Back to School: Credit Pressures Build for U.S. School Districts
September X, 2026

Local government credit quality has generally remained resilient, but school districts have become a disproportionate source of negative rating momentum within the municipal sector. While the sector remains fundamentally important and historically stable, districts now face a broader set of pressures, including declining enrollment, the expiration of temporary federal aid, rising expenditures, and property tax reform. These forces are beginning to drive greater credit differentiation.1
From the beginning of 2026 through mid-August 2026, the school district sector recorded 417 negative rating actions — downgrades, negative outlooks, and negative watches — across Fitch Ratings, S&P Global, and Moody’s.2 This total was the highest of any municipal sector, accounting for more than 30% of negative rating activity across the 67 municipal sectors tracked by Bloomberg and nearly 1.7 times the activity recorded in the Local GO sector. Looking ahead, school district credit quality will increasingly depend on management’s ability to align staffing, programs, and capital plans with a more constrained and structurally challenging revenue environment. Districts with stronger financial flexibility, governance discipline, and demonstrated political support should be better positioned to adjust.
Three pressures are especially important for future school district credit quality: weakening enrollment trends, the transition away from temporary federal aid, and growing political pressure to limit property taxes.
Enrollment Pressure and Demographic Headwinds
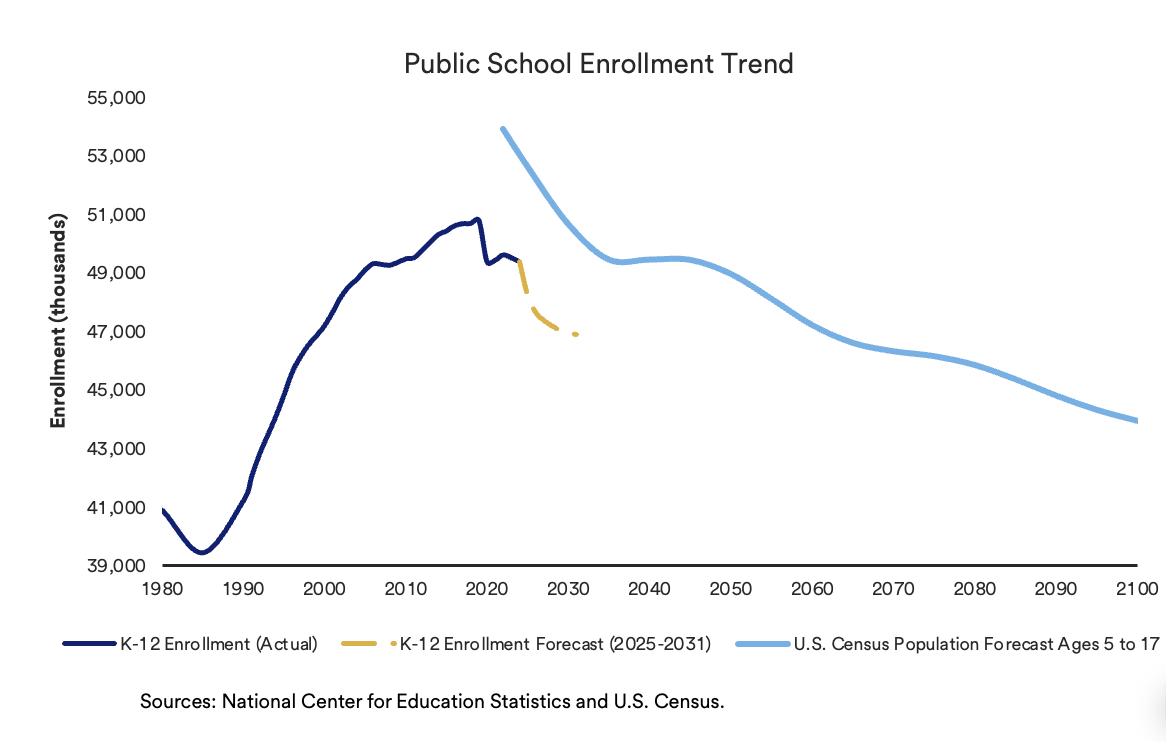
Because school funding is closely tied to student counts, stable enrollment is critical to district financial performance. According to the National Center for Education Statistics, U.S. public school enrollment peaked in 2019 at 50.79 million students and declined 2.8% in the first year of the pandemic. Although enrollment recovered modestly in 2021 and 2022, the trend has since weakened again and is expected to remain challenged for the foreseeable future. The Midwest and Northeast are likely to experience these pressures earlier and more acutely than other regions.3
The U.S. Census Bureau’s 2023 National Population Projections forecast that the 5-to-17-year-old cohort will decline through 2100, with the steepest decline occurring over the next decade. By 2035, that age group is projected to fall 6.4%.4 These projections could also be affected by recent changes in immigration policy, which may further constrain school-age population growth. At the same time, many districts face additional enrollment headwinds from charter school competition, private school options, and domestic migration patterns.
Temporary Federal Aid and Cost Adjustment
Although K-12 enrollment growth had slowed before the pandemic, most school districts entered COVID-19 with generally solid credit quality. To help states and districts respond to pandemic-related disruptions, Congress created the Elementary and Secondary School Emergency Relief Fund (ESSER) in March 2020. Across three federal laws, nearly $190 billion was appropriated for ESSER, with most funding flowing to local school districts. States and districts were required to obligate the final round of ESSER funds by September 30, 2024, and generally had to spend those funds within 120 days of the obligation deadline.5
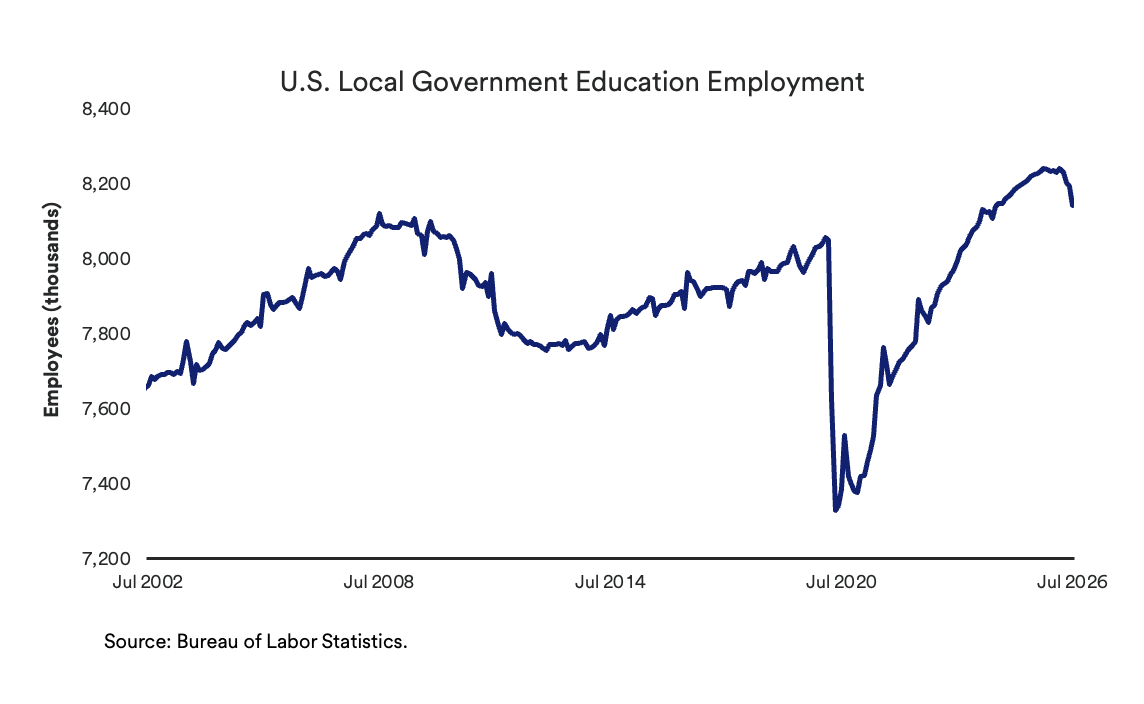
ESSER funding helped districts address the operational and instructional disruptions caused by COVID-19, but it also created a credit challenge where one-time federal aid supported costs that may be recurring. A September 2024 GAO report found that approximately 80% of ESSER spending through the 2021–22 school year was directed toward students’ academic, social, and emotional needs and maintaining school operations.5 Separately, a Department of Education report for FY 2023 showed that nearly half of ESSER expenditures supported salaries and benefits for educators and other personnel. The report also noted that “there are now more people working in America’s schools than at any time in the last decade” and that, as of October 2024, local public schools had added 642,000 jobs since 2021.6
The credit risk is that many of these positions and programs may represent ongoing costs funded with temporary revenues. As a result, districts must identify sustainable replacement funding, reduce expenses, or right-size operations as they adjust to the expiration of federal aid. Local education employment peaked in October 2025 and has begun to decline as districts work through that transition.
Property Tax Reform
A third headwind is growing voter fatigue and the increasing political focus on property tax relief. In the years following COVID-19, lawmakers have repeatedly pursued measures to reduce — or, in some cases, eliminate — property taxes to address housing affordability.7 According to CNBC, voters across the country will consider 26 ballot initiatives concerning tax rates in 13 states this fall. Florida, Georgia, Louisiana, Oklahoma, North Carolina, Tennessee, and Wyoming all have proposals on the ballot that would significantly curb property tax revenues. In Florida, the governor’s original proposal was to eliminate all property taxes, although it was later revised to exclude school district levies. Nationwide, property taxes account for more than 70% of local government funding and have historically provided a stable and predictable revenue source.8,9 Changes to this framework could have meaningful implications for school districts by reducing flexibility to manage state aid volatility, enrollment-related revenue declines, and rising labor and capital costs.
Taken together, these pressures point to a more demanding credit environment for school districts. Enrollment weakness can constrain state funding, the expiration of ESSER aid is forcing districts to adjust recurring cost structures, and property tax reform could limit one of the sector’s most reliable revenue sources. The combined effect is likely to place greater emphasis on management discipline, budget flexibility, and local political support.
School districts are entering a more challenging operating environment. In some cases, inflation and expanding service responsibilities have pushed expenditures ahead of recurring revenues, contributing to reserve pressure and forcing difficult decisions around staffing, programming, and capital needs.
We expect budgetary pressure to persist over the next several years, which may continue to weigh on ratings. However, these challenges are more likely to drive greater credit dispersion than broad-based distress. Many districts continue to benefit from strong reserves, essential-service characteristics, state support — including state bond guarantee and credit enhancement programs — and demonstrated local willingness to fund education. The sector remains fundamentally important and historically resilient, but credit outcomes are becoming less uniform. As those outcomes diverge, careful issuer selection will become increasingly important, and professional research and active management can help investors distinguish between districts facing temporary budget strain and those confronting more persistent structural pressures.
Sources
1. S&P Global Ratings. School’s Back in Session and Some U.S. K-12 Public Districts Won’t Make the Grade. September 11, 2025. https://www.capitaliq.spglobal.com/apisv3/spg-webplatform-core/ratingsdirect/creditresearch?rid=3440108
2. Bloomberg Intelligence. Moody’s, S&P, Fitch Ratings Tracker. August 12, 2026.
3. National Center for Education Statistics. “Enrollment in Public Elementary and Secondary Schools, by Level and Grade: Selected Years, Fall 1980 Through Fall 2024.” Digest of Education Statistics, Table 203.10.
https://nces.ed.gov/programs/digest/d25/tables/dt25_203.10.asp
4. U.S. Census Bureau. 2023 National Population Projections Tables: Main Series. 2023. https://www.census.gov/data/tables/2023/demo/popproj/2023-summary-tables.html
5. U.S. Government Accountability Office. K-12 Education: School Districts Reported Spending Initial COVID Relief Funds on Meeting Students’ Needs and Continuing School Operations. September 2024. https://www.gao.gov/assets/gao-24-106913.pdf
6. U.S. Department of Education. Elementary and Secondary School Emergency Relief Fund Fiscal Year 2023 Annual Performance Report. 2024. https://www.ed.gov/media/document/esser-fiscal-year-2023-annual-performance-report-109451.pdf
7. S&P Global Ratings. U.S. K-12 School Districts Are Facing a Confluence of Credit Pressures. July 22, 2026. https://www.capitaliq.spglobal.com/apisv3/spg-webplatform-core/ratingsdirect/creditResearch?rid=3598876
8. CNBC. “Property Taxes Are Poised for Major Midterm Elections Ballot Battles Across Many U.S. States.” July 21, 2026. https://www.cnbc.com/2026/07/21/property-taxes-midterm-elections-ballots-issues.html
9. Pew Charitable Trusts. “State Property Tax Reform Efforts Continue Amid Local Fiscal Strains.” February 24, 2026. https://www.pew.org/en/research-and-analysis/articles/2026/02/24/state-property-tax-reform-efforts-continue-amid-local-fiscal-strains