Managing Around Inflection Points - An Overview of Our Core Bond Investment Philosophy
September X, 2025

Our investment philosophy for managing core bond portfolios is based on a set of principles that seek to form a consistent, repeatable framework for investment decision-making. We believe strong and consistent performance over a full market cycle is rooted in our ability to position portfolios and manage risk throughout each stage of the business and economic cycle. The goal is to anticipate and reposition portfolios ahead of major inflection points between stages of the cycle, periods which tend to drive larger market moves.
Stages of the Business and Economic Cycle
We define four stages of the business and economic cycle as follows:
1) Expansion: Economic growth accelerates, monetary policy tightens, debt increases as corporate management teams focus on equity holders, financial innovation expands, economic and market excesses build.
2) Downturn: Economy typically falls into recession, the credit cycle tips into a downturn, corporate profits fall, credit conditions tighten, credit spreads widen, risk appetite and liquidity declines, monetary policy easing and fiscal stimulus ensues.
3) Credit Repair: Economic growth remains lackluster, companies are forced to improve their balance sheets, credit spreads are relatively wide, central bank monetary policy remains easy and supportive.
4) Recovery: Economic growth improves, lending standards ease, corporate profits recover, corporate management teams balance interests of debt holders and equity holders, central banks begin dialing back easing policies.
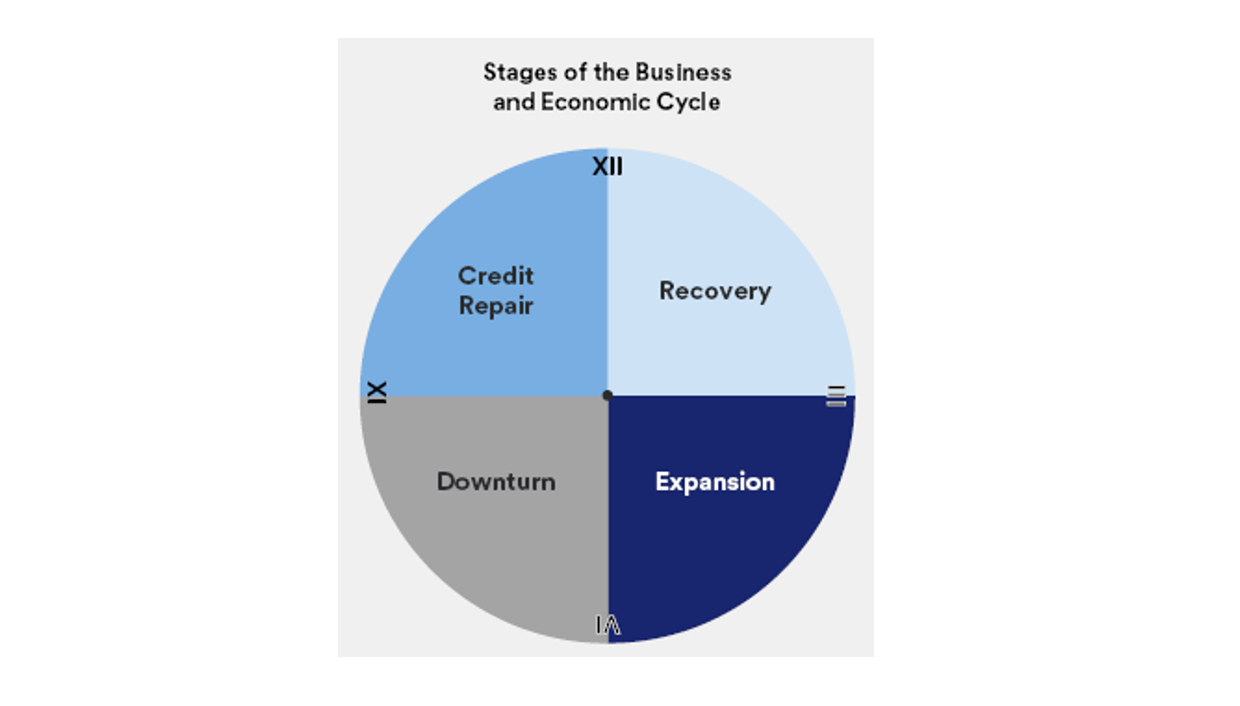
Each stage of this cycle historically leads to the next stage in succession. A downturn typically follows an expansion, which is then followed by a credit repair phase, ultimately a recovery, and finally back to expansion again. The duration of each stage can vary significantly and is influenced by numerous factors, such as government intervention, consumer and business behavior, and financial market responses. While the downturn stage often feels the most severe, it also tends to be the shortest due to rapid deployment of supportive monetary and fiscal policy. As such, understanding these policies and their potential impact is crucial. Conversely, the expansion stage tends to be the longest, often resulting in excesses building up in one or more sectors of the economy. For example, the period from 1991-2000 was one of the longest periods of economic expansion in U.S. history at that point, ending with the collapse of the dot-com bubble in 2000-2001.
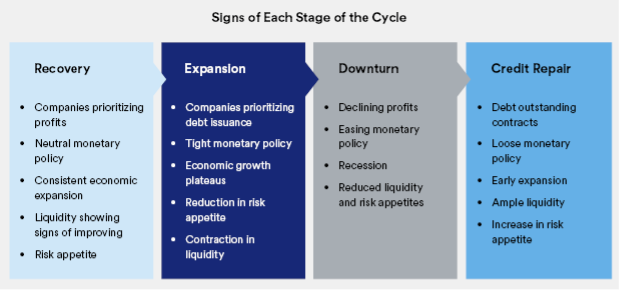
Then, the economy experienced a period of growth from 2002-2007 before succumbing to the sub-prime mortgage crisis that triggered the 2007-2009 Global Financial Crisis. Expansions can also end with a systemic shock, such as 9/11 or the COVID-19 pandemic. Whether caused by a bubble bursting in sectors with excesses or an external systemic shock, economic downturns affect various parts of the investment marketplace differently. The telltale signs of each stage of the cycle are shown below.
For example, the Global Financial Crisis followed this cycle:
· Expansion: 2005-2007
· Downturn: 2007-2009
· Credit repair: 2009-2011
· Recovery: 2011-2014
· Expansion: 2014-2020
The COVID-19 pandemic followed a similar pattern:
· Expansion: 2014-2020
· Downturn: early - mid-2020
· Credit repair: mid-2020 - 2021
· Recovery: 2022 - 2023
· Expansion: 2023 - present
Investment Strategies During the Phases of the Business Cycle
We believe there are key top-down and bottom-up portfolio and asset allocation decisions for each stage of the cycle. The infographic below broadly describes our views on the changes to positioning for portfolios based on each stage of the previously identified cycle. However, as no two cycles are the same, the optimal top-down and bottom-up decisions will vary depending on the specific causes and circumstances.
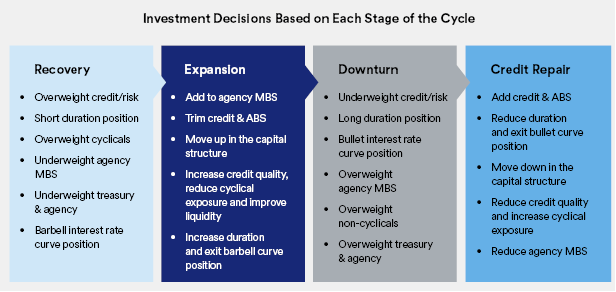
Some of the top-down positions make intuitive sense. For example, during a downturn, growth generally slows and the Federal Reserve (Fed) may cut interest rates, which benefits longer duration and bulleted interest rate curve positioning, but credit spreads may widen.
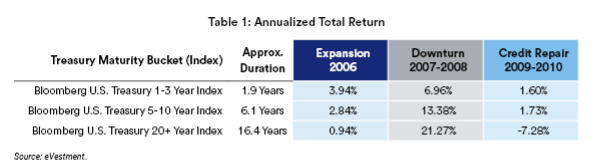
As shown in Table 1, the largest annualized total returns amongst short, intermediate, and long duration U.S. Treasury indices during the downturn phase (2007 and 2008) occurred in the longer duration indices (i.e. those with more sensitivity to changes in interest rates). Conversely, during the latter part of the expansion phase interest rates are typically rising as growth and inflation may be overheating and the Fed is likely to be raising rates. In this case, shorter duration (less interest rate sensitive) fixed income strategies tend to outperform longer duration strategies as shown during the end of the expansion phase (2006).
Other decisions are not as intuitive. For example, during the credit repair phase, valuations tend to be cheaper (wider spreads) while at the same time corporations have just begun taking measures to improve balance sheets and overall credit profiles. This presents opportunities to selectively buy out-of-favor, lower-rated issuers or issuers with high cyclical exposure. Waiting until the recovery is under way may make the opportunity more obvious, but at the expense of missing out on securities at cheaper spreads levels.
Finally, sectors such as agency mortgage-backed securities (MBS) tend to perform better when corporate credit is out of favor and when interest rate volatility is declining. As such, agency MBS tend to perform better on a relative basis during the latter portion of the expansion and downturn stages but underperform credit during the credit repair and recovery stages.
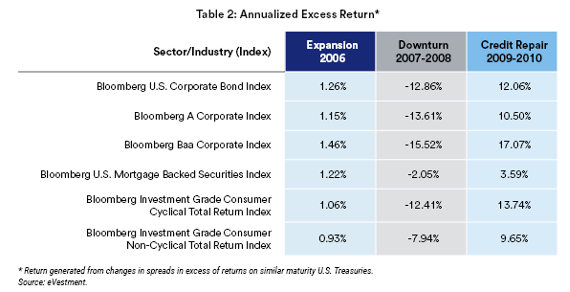
Table 2 shows that the annualized excess return (return generated from changes in spreads in excess of returns on similar maturity U.S. Treasuries) of the U.S. Corporate Bond Index exceeded that of the Mortgage-Backed Securities Index during the credit repair phase (2009 and 2010) and vice versa during the downturn phase (2007 and 2008). Additionally, the lower credit quality index (Baa Corporate Index) and consumer cyclical index (Investment Grade Consumer Cyclical Index) generated a higher excess return than the higher credit quality index (A-rated Corporate Index) and consumer non-cyclical index (Investment Grade Consumer Non-Cyclical Index) during the credit repair phase (2009 and 2010).
Conversely, the higher credit quality index and consumer non-cyclical index generated a higher excess return than the lower credit quality index and consumer cyclical index during the downturn phase (2007 and 2008). These relationships tend to recur during similar phases of the market cycle, creating opportunities to add value by carefully repositioning portfolios ahead of the transition points.
Investment Performance Over the Economic and Business Cycle
Investment performance can be measured (i) on an absolute basis, (ii) relative to a benchmark such as the Bloomberg U.S. Aggregate Bond Index, and (iii) relative to a peer group of similarly managed strategies. Return dispersion versus the benchmark and amongst the peer group tends to increase in the year(s) following an inflection point between cycle stages, particularly during the downturn and credit repair stages.
For example, according to eVestment U.S. Core Fixed Income peer group data:
- In 2006 (expansion), the total return difference between top and bottom quartile managers was only 0.53% (53 basis points).
- In 2007 (initial downturn), the difference widened to 1.21% (121 basis points).
- In 2008 (depths of the downturn), quartile dispersion surged to 7.1% (710 basis points).
- In 2009, (initial stage of credit repair), quartile dispersion remained elevated at 5.07% (507 basis points).
- In 2018 (expansion), quartile dispersion contracted to 0.60% (60 basis points).
Additionally, roughly 70% of bond managers within the eVestment U.S. Core Fixed Income universe outperformed the Bloomberg U.S. Aggregate Bond Index on a gross of fees basis during the expansion phase in 2006. But the percentage of managers outperforming the index fell to 45% in 2007 and only 33% in 2008 during the downturn phase. In 2009, as the market began to move from the downturn phase to the credit repair phase, 85% of bond managers within the peer group outperformed the associated index. As the cycle progressed, dispersion shrunk again and by 2018, the total return difference between a top quartile manager and bottom quartile manager declined while roughly 50% of bond managers within the peer group outperformed the associated index.
Most recently, over the trailing 12-months ended June 30, 2025, the total return difference between a top quartile manager and bottom quartile manager was only 0.39% (39 basis points). In comparison, on a calendar year basis, 39 basis points is the smallest difference since this data became available in the early 1970s, according to eVestment data.
By positioning portfolios and managing risk for both the current stage of the cycle as well as ahead of key inflection points, managers can outperform the benchmark as well as their peer group over a full market cycle. This is especially important during the downturn and credit repair phase when manager performance dispersion between the top and bottom quartile tends to be widest.
Our Approach
Mark Twain once said, “History doesn’t repeat itself, but it often rhymes.” Each economic and business cycle is unique, including the ultimate cause of the downturn, the excesses that build up during the expansion phase, and the length of time we spend in each stage of the cycle. However, the Fed’s response, corporate and consumer behavior, and the market’s response tend to be similar regardless of the cause of the cycle.
Successful investing is about making the right investment decisions at the right time and at the right price. However, there is less penalty for defensively repositioning portfolios ahead of an inflection point when valuations are historically rich and manager dispersion is small but a greater penalty for repositioning too late when dispersion tends to increase significantly.
By understanding the telltale signs of the current stage of the cycle as well as potential catalysts leading to a transition into the next stage of the cycle, we work to position portfolios for these inflection points as we seek to safely generate strong relative performance over the full market cycle.
For more any questions about this report, please reach out to your relationship manager.