Quarterly Portfolio Manager Commentary
September 30, 2025

Cash Management Portfolios
What market conditions had a direct impact on the bond market this quarter?
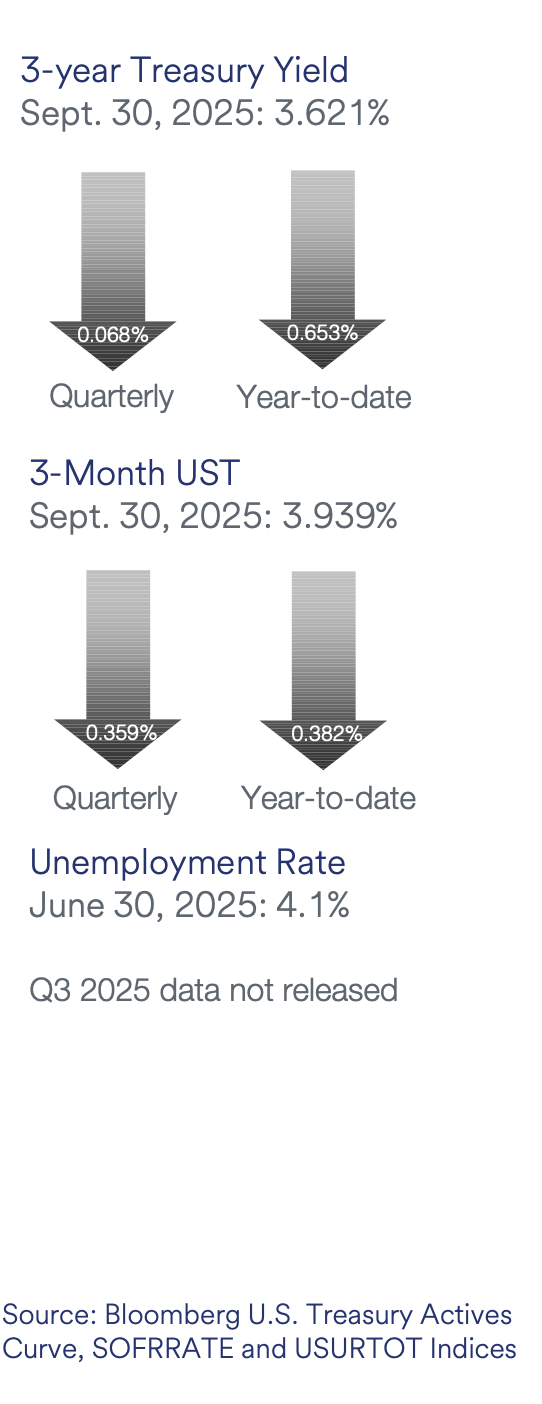
Economic Activity – U.S. economic growth outperformed expectations in the third quarter of 2025 (Q3), driven by a continued unwind of the trade and inventory dynamics from earlier in the year as well as durable consumption levels and elevated business investment, notably AI-related investments. U.S. Gross Domestic Product (GDP) is projected to grow near 2.0% for Q3. Growth is forecast to slow toward 1.0%-1.5% to close the year amid headwinds from persistent trade policy uncertainty and elevated inflation, but a more accommodative Federal Reserve (Fed) and tax policy incentives should provide support for GDP next year. Consumer spending remained resilient during the quarter, supported by higher income households. This comes despite growing concerns over slower hiring and persistent inflation eroding purchasing power. Employment conditions continued to weaken throughout the quarter with labor demand grinding to a halt as cautious businesses continue to adopt a low-hire/low-fire strategy. The gradual decline in U.S. job openings continued with August openings at 7.2 million positions while the total number of unemployed workers in the labor force as of August was 7.4 million, the highest level since September 2021. At the time of this writing, the September employment data remained delayed due to the government shutdown, but growth in Monthly Nonfarm Payrolls (NFP) slowed sharply throughout Q3 to an average of 29,000 over the prior three months through August and the U3 Unemployment Rate increased to 4.3% in August. Average Hourly Earnings growth slowed to 3.7% year-over-year (YoY), moving closer to pre-pandemic levels. Inflation pressures accelerated in Q3 with the Consumer Price Index (CPI) increasing to 2.9% in August, led by rising goods prices and sticky services costs. Core inflation was also higher with CPI ex. food and energy rising 3.1% YoY for August and the Fed’s preferred inflation index – the PCE Core Deflator Index – increasing 2.9% YoY. While the inflationary impact of tariffs has been more manageable than originally expected, the reacceleration of core inflation and upcoming fiscal stimulus make achieving the Fed’s 2% target unlikely in the near-term.
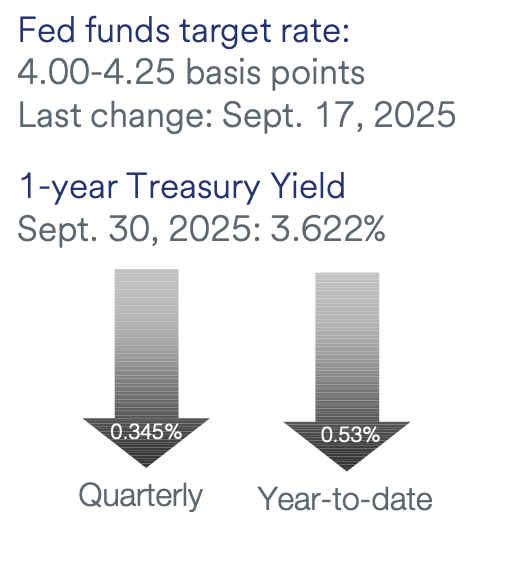
Monetary Policy – The Fed lowered the federal funds target range by 25 basis points (bps) to 4.0% to 4.25% at its September meeting. The Fed’s post-meeting statement was revised, adding that job gains have slowed and the unemployment rate has edged up but remains low. The statement also reiterated inflation remains “somewhat elevated.” During the post-meeting press conference, Fed Chair Powell characterized the policy action as a “risk management” cut, and highlighted downside risks to employment have risen. Additionally, the Fed maintained the pace of its balance sheet reduction program (quantitative tightening) with a monthly cap on Treasury securities of $5 billion and on agency mortgage-backed securities of $35 billion.
The Federal Open Market Committee (FOMC) released its updated Summary of Economic Projections at the September meeting. The FOMC’s “dot plot” suggests an additional 50 bps in rate cuts by the end of 2025 (target range of 3.50% to 3.75%), although the committee is divided with seven members favoring no additional cuts in 2025 and another two members calling for one 25 bps rate cut. The median dots show further rate cuts of 25 bps in 2026 and 25 bps in 2027, and the estimated longer-run neutral rate was unchanged at 3.0%. The FOMC’s economic projections were revised to show a higher real GDP growth forecast through 2027, a lower projected unemployment rate for 2026-2027, and increased inflation in 2026 compared to the prior release. Interestingly, the FOMC strengthened their economic outlook despite projections for a lower policy rate path.
Fiscal Policy – The third quarter was another period of active fiscal policy as the quarter started with passage of the sweeping One Big Beautiful Bill Act on July 4 and ended with the federal government entering a shutdown. And in between there was a continual flow of tariff-related announcements including enactment of the “Liberation Day” tariffs (initially paused for 90 days) and additional sector-specific actions. While the tariff landscape continues to evolve, including an upcoming hearing at the Supreme Court on the legality of tariffs issued under the International Emergency Power Act, they are here to stay in one form or another given their significance within the Trump administration’s agenda. The One Big Beautiful Bill Act, among other things, permanently extends the 2017 tax cuts, boosts spending for defense, immigration, and border control, and raises the debt limit by $5 trillion. The Act also includes the resumption of bonus depreciation and spending cuts to Medicaid and clean-energy tax credits and subsidies. Passage of the Act should provide a modest boost to economic growth beginning early next year and removes debt ceiling risk for a couple of years.
To close out the quarter, the federal government entered a shutdown on October 1 after Congress failed to pass a funding bill by September 30. At the time of this writing the shutdown continues, with House Republicans having passed a continuing resolution to fund the government at current levels through November 21, but the Senate has yet to come to agreement as Democrats are holding out for a bill that would extend subsidies for Affordable Care Act (ACA) coverage. While we expect the government shutdown to have a limited long-term effect on growth, the Trump administration’s stated desire to layoff rather than furlough a large number of federal workers could pose a greater than normal risk to near-term sentiment. On the municipal front, the sector faces growing financial pressures from increased local funding needs, expiration of federal pandemic aid, and economic uncertainties related to tariffs. Municipalities enter this period from a position of relative strength, however, as solid revenues and robust reserves provide the flexibility needed to navigate these headwinds.
Credit Markets – Equity and bond markets stabilized in the third quarter after a volatile first half of the year. While tariff uncertainty remained elevated, the absence of worst-case trade scenarios and progress in global supply chain adjustments helped calm investor nerves. Investment-grade credit spreads ground tighter, ending the quarter at or near multi-year lows. New issuance surged in the quarter, particularly in September, and was met with robust investor demand for new corporate and asset-backed debt. Secondary market liquidity remained strong and there was no meaningful deterioration in the credit quality of held positions.
Yield Curve Shift
|
U.S. Treasury Curve |
Yield Curve 6/30/2025 |
Yield Curve 9/30/2025 |
Change (bps) |
|---|---|---|---|
|
3 Month |
4.291% |
3.932% |
-35.9 |
|
1 Year |
3.967% |
3.614% |
-35.2
|
|
2 Year |
3.719% |
3.608% |
-11.1 |
|
3 Year |
3.689% |
3.619% |
-7.0 |
|
5 Year |
3.797% |
3.741% |
-5.6 |
|
10 Year |
4.228% |
4.150% |
-7.8 |
Duration Relative Performance
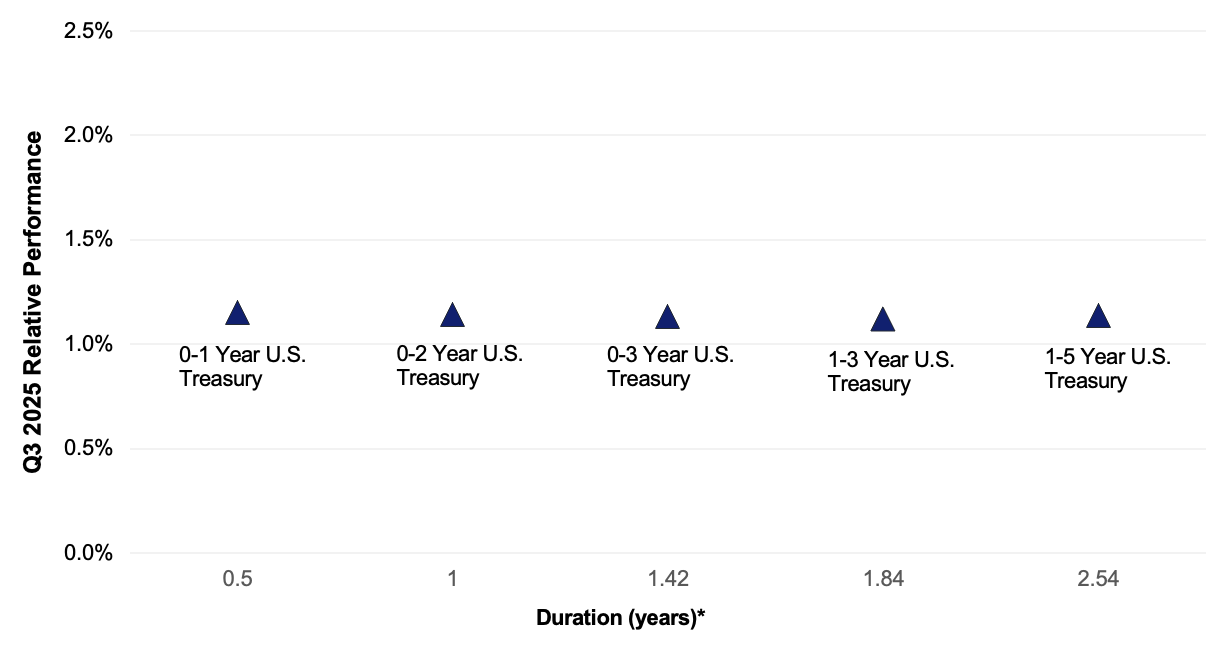
*Duration estimate is as of 9/30/2025
Falling yields contributed to the quarter’s strong fixed income returns. The three-month to 10-year portion remained inverted, with front-end yields remaining stable on no Fed policy changes in the quarter and 10-year yields only rising 2.3 bps. With two to five-year yields falling more than short-term yields, longer duration strategies outperformed short duration strategies. There was some volatility along the front-end of the yield curve, with two-year yields trading within a range of 3.60% and 4.05% in the quarter, presenting some tactical opportunities to position portfolio duration.
Credit Spread Changes
|
ICE BofA Index |
OAS* (bps) 6/30/2025 |
OAS* (bps) 9/30/2025 |
Change (bps) |
|---|---|---|---|
|
1-3 Year U.S. Agency Index |
2 |
1 |
-1 |
|
1-3 Year AAA U.S. Corporate and Yankees |
2 |
5 |
3 |
|
1-3 Year AA U.S. Corporate and Yankees |
23 |
23 |
0 |
|
1-3 Year A U.S. Corporate and Yankees |
47 |
40 |
-7 |
|
1-3 Year BBB U.S. Corporate and Yankees |
72 |
66 |
-6 |
|
0-3 Year AAA U.S. Fixed-Rate ABS |
48 |
41 |
-7 |
Despite already being near multi-year lows, corporate credit spreads tightened further in the quarter on strong investor demand. Credit spreads are being supported by solid corporate fundamentals, favorable technical factors and improving economic optimism.
Credit Sector Relative Performance of ICE BofA Indexes
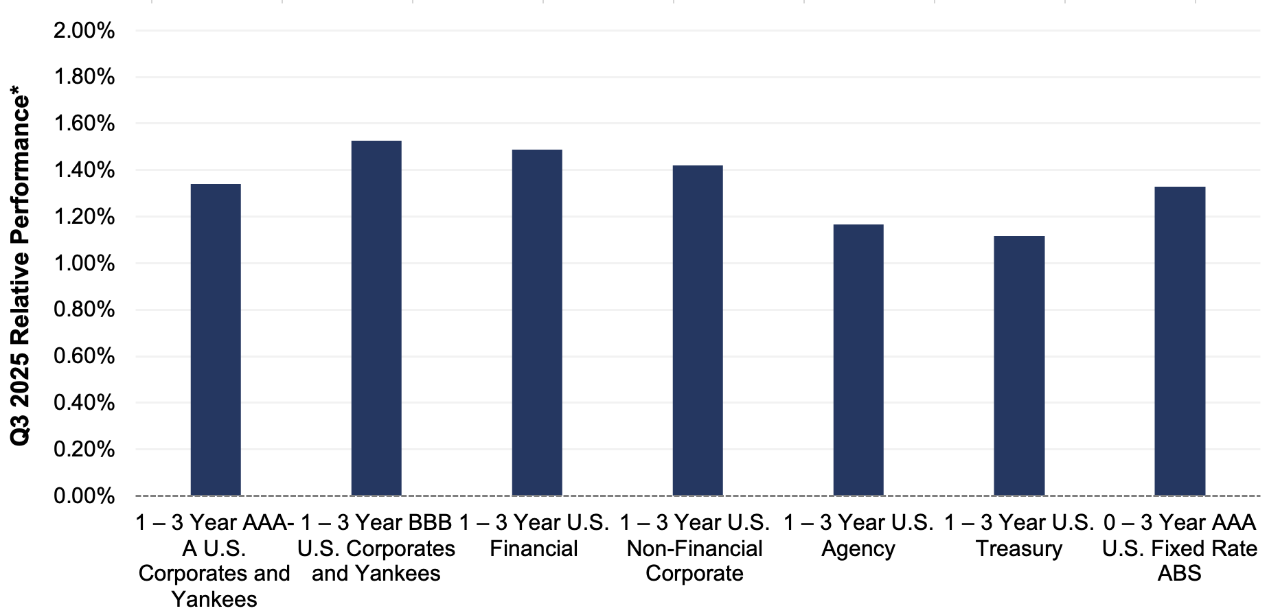
ICE BofA Index
*AAA-A Corporate index outperformed the Treasury index by 23.0 bps.
*AAA-A Corporate index underperformed the BBB Corporate index by 17.8 bps
*U.S. Financials outperformed U.S. Non-Financials by 6.8 bps
Similar to the second quarter, lower Treasury yield curve levels and tighter credit spreads across the investment-grade universe generated strong absolute performance for all fixed income sectors. Down-in-credit outperforming higher-rated credit was a general theme, highlighted by the BBB corporate index’s 17.8 bps outperformance of the AAA-A corporate index.
What strategic moves were made and why?
Taxable Portfolios – The combination of attractive embedded portfolio yields, tighter credit spreads and lower yield curve levels generated strong fixed income returns in the quarter. With the Fed cutting policy rates for the first time since last December and the expectation for more in the fourth quarter, the front-end of the U.S. treasury curve steepened and levels declined overall. Our duration neutral – aka “don’t get caught short” – strategy benefitted absolute portfolio performance by locking in higher coupon yields and contributing incremental performance from rising bond prices. On a relative basis however, duration positioning did not have a meaningful impact as treasury indexes with duration from .5 years to 2.5 years all reported returns within 4 bps of each other in the quarter. Robust investor demand for yield tightened investment-grade credit spreads from already historically tight levels. Highlighting the market’s decided risk-on sentiment, the BBB corporate debt index outperformed AAA-A rated corporates by 17.8 bps, building on the second quarter’s 19.6 bps excess gain. Asset-Backed Securities (ABS) outperformed comparable duration treasuries, but mildly underperformed AAA-A corporates by a 1.9 bps. Volatility was more muted in the third quarter and financial markets continued to function properly with solid secondary market liquidity and strong demand for new issue corporate debt. There were no significant credit or rating events in the quarter, and no single issuer or position had a meaningfully positive or negative impact on portfolio performance.
Tax Exempt and Tax-Efficient Portfolios – Municipal yields fell substantially, with reinvestment demand from municipal bond maturities and coupon payments providing the primary impetus for the move lower. Additionally, as broader fixed income yields revisited six-month lows, flows into long-term municipal bond funds and ETFs surged. These inflows exceeded $4 billion in mid- September, the highest weekly inflow observed in data going back to 2013. New issue supply has declined sequentially in each month since June, however, comparisons versus 2024’s record breaking pace still show increases of approximately 13% for Q3 2025 versus Q3 2024, and 15% on a year-to-date basis.
Overall technicals were favorable for the bond prices of existing holdings, but made it more difficult to find value in new purchases. We preferred taxable municipal bonds over tax-exempt due to the 70 to 100 bps yield advantage they provided on a taxable equivalent comparison. These purchases were mostly defensive in nature and intended to keep portfolio durations from drifting too short versus benchmarks.
How are you planning on positioning portfolios going forward?
Taxable Portfolios – We are forecasting two additional 25 bps Fed rate cuts in the fourth quarter. With the near-term direction of interest rates pointing lower and the tight trading range of the front-end U.S. treasury curve limiting tactical positioning opportunities, we plan to maintain portfolio durations near 100% of benchmarks. Further, we will position portfolios to take advantage of what we believe will be a curve-steepening bias in the market. Investment-grade corporate bond spreads enter the quarter at near multi-year lows across most maturity structures. While we expect strong investor demand for yield to continue and corporate credit conditions to remain benign on solid technical and fundamental factors, stretched valuations make incremental returns from further spread compression unlikely. In this environment, security selection and new issue opportunities play an even more critical role in identifying pockets of value. AAA-rated ABS continues to offer more yield than equivalent-maturity AAA-A corporates. Our ABS strategy emphasizes structures backed by prime borrowers, given concerns over consumer health in the sub-prime sector. With spreads in the low single digits, U.S. Agency debt will remain de-emphasized in favor of U.S. treasuries in the government sector. Given credit valuations are seemingly priced to perfection, we will strive to protect portfolio performance by lowering overall credit duration, trimming positions perceived as overvalued where appropriate and migrating exposure toward higher-quality issuers.
Tax Exempt and Tax-Efficient Portfolios – Portfolio durations for most accounts are currently at, or near, neutral levels versus benchmarks. This positioning affords us some short-term flexibility in terms of security selection. We had been expecting more attractive relative value for municipals bonds to comparable maturity Treasuries to materialize in the September to October timeframe. So far, we have not seen the cheapness we had anticipated. However, ratios have at least bounced off minimum levels and now approximate longer-term averages. We would prefer to initiate duration extension trades in October, as we are mindful that municipal market supply can slow going into year-end. Our objective is to maintain duration neutral positioning as opportunities allow.
Sources
Bloomberg
https://www.federalreserve.gov/monetarypolicy/files/monetary20250917a1.pdf
https://www.federalreserve.gov/monetarypolicy/files/fomcprojtabl20250917.pdf
https://economics.bmo.com/en/publications/detail/56a75a45-fbc2-49b6-9fd3-0fd5426af907/
https://budgetlab.yale.edu/research/state-us-tariffs-september-26-2025
https://blinks.bloomberg.com/news/stories/T3QF8FGOYMTE