Quarterly Portfolio Manager Commentary
March 31, 2026

Cash Management Portfolios
What market conditions had a direct impact on the bond market this quarter?
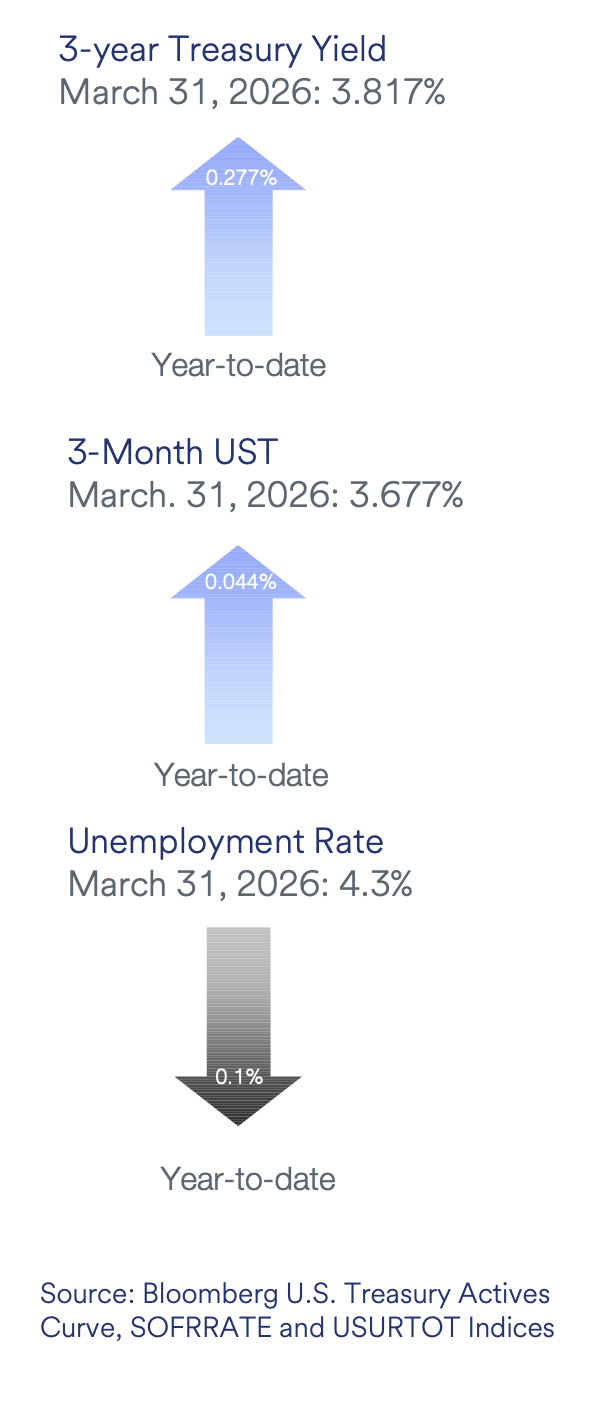
Economic Activity – U.S. economic activity during the first quarter of 2026 (Q1) reflected a stable yet cautious expansion, with moderate growth persisting despite rising geopolitical concerns. U.S. Gross Domestic Product (GDP) growth is projected to be near 2.0-2.5% in Q1, supported by consumer spending and business investment. Growth was further aided by a rebound in government activity following the extended federal government shutdown in the fourth quarter of 2025. Consumer spending ended the quarter on firmer footing after a weak start, with positive momentum leading into the conflict in the Middle East. While aggregate spending remains resilient, it has become increasingly concentrated among high-income households, raising concerns about the sustainability of a two-speed growth trajectory amid the recent surge in energy costs. Employment conditions continue to exhibit monthly volatility, but overall trends imply labor market resilience and stabilization as the low-hire, low-fire environment persists. U.S. job openings fluctuated throughout the quarter but maintained their broader downward trend, with February openings at 6.9 million versus 7.2 million total unemployed workers in March. Monthly Nonfarm Payrolls (NFP) growth averaged 68,000 per month during the quarter, an acceleration compared to the prior quarter, but well below historic levels. Low payroll growth is not inherently bad as low layoff activity and slower labor force growth have helped stabilize the unemployment rate, which the Federal Reserve (Fed) views as a more reliable gauge of labor market health. The U3 Unemployment Rate was 4.3% as of March. Average hourly earnings continued their gradual descent, rising 3.5% year over year in March. Inflation pressures accelerated to close out the quarter, with the headline Consumer Price Index (CPI) rising 3.3% in March, reflecting a sharp increase in energy prices. Core CPI (excluding food and energy) remained more subdued at 2.6% year over year, while the Fed’s preferred inflation measure, the core Personal Consumption Expenditures (PCE) deflator, rose 3.0% year over year in February. The extent to which higher energy prices feed into core inflation is less clear and will depend on the duration of the Middle East conflict, but poses a greater risk given the downside to growth and the Fed’s limited capacity to respond.
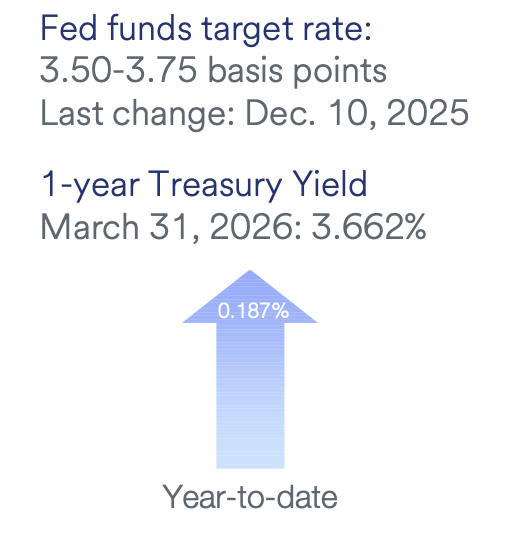
Monetary Policy – The Fed paused its easing cycle in Q1, holding the federal funds rate at 3.50% to 3.75% in January and March Federal Open Market Committee (FOMC) meetings. Governors Waller and Miran dissented in January in favor of a 25 basis points (bps) cut, with Miran again dissenting in March. The Fed noted stable unemployment and uncertainty from Middle East developments, while continuing reserve management purchases (RMPs) of Treasury bills at about $40 billion per month, expected to taper to $20 to $25 billion per month beginning this summer.
The FOMC released its updated Summary of Economic Projections in March, which showed higher expected GDP growth, higher inflation in 2026-2027, and higher unemployment in 2027. Despite this, the “dot plot” remained unchanged, with the FOMC signaling one additional 25 bps cut in 2026 and 2027. The estimated longer-run neutral rate edged slightly higher from 3.0% to 3.125%. Markets currently expect the Fed to remain on hold in 2026 amid growing risks to inflation and growth.
Fiscal Policy – Fiscal policy remained expansionary during Q1, highlighted by increased government spending and continued implementation of the One Big Beautiful Bill Act (OBBBA). Among other things, the OBBBA provides fiscal stimulus through enhanced household tax refunds and favorable business expensing provisions designed to support consumer spending and business investment. In February, Congress passed the Consolidated Appropriations Act, providing funding for more than 95% of the federal government through the end of FY2026 (ends Sept 2026), locking in higher discretionary spending across defense, health, education, and infrastructure. Balancing out these efforts were increased tax revenues and tariff collections which provided an improvement in the budget deficit.
Looking ahead, we anticipate fiscal policy to be quiet as we approach the midterm elections in November as significant differences between the two political parties preclude meaningful legislation. Additionally, the Supreme Court’s ruling against the Administration’s use of the International Emergency Economic Powers Act (IEEPA) to implement tariffs adds near-term uncertainty over trade policy. The Administration quickly pivoted to other methods to implement tariffs, including a temporary 10% global import surcharge under Section 122 and launching more legally durable Section 301 investigations against several trading partners. These actions suggest average effective tariff rates will be little changed, but trade uncertainty remains given yet to be determined rates on individual countries and products. On the municipal front, the sector faces growing financial pressures from increased local funding needs, the exhaustion of federal pandemic aid, and economic uncertainties related to tariffs. Municipalities enter this period from a position of relative strength, however, as solid revenues and robust reserves provide the flexibility needed to navigate these headwinds.
Credit Markets – Financial markets were unsettled in March as traders grappled with geopolitical tensions and rising energy prices. Bond markets experienced heightened interest rate volatility and shifting expectations for Federal Reserve policy. Despite persistent uncertainty surrounding inflation and economic growth, credit fundamentals remained stable with no signs of meaningful deterioration. Investment-grade spreads did widen some from historical tights, but the move was modest. New issuance remained robust even through the volatility, underscoring the resilience of the investment-grade market and the dominance of structural demand.
Yield Curve Shift
|
U.S. Treasury Curve |
Yield Curve 12/31/2025 |
Yield Curve 3/31/2026 |
Change (bps) |
|---|---|---|---|
|
3 Month |
3.633% |
3.677% |
4.4 |
|
1 Year |
3.475% |
3.662% |
18.7
|
|
2 Year |
3.475% |
3.796% |
32.1 |
|
3 Year |
3.540% |
3.817% |
27.7 |
|
5 Year |
3.726% |
3.944% |
21.8 |
|
10 Year |
4.169% |
4.319% |
15.0 |
Duration Relative Performance
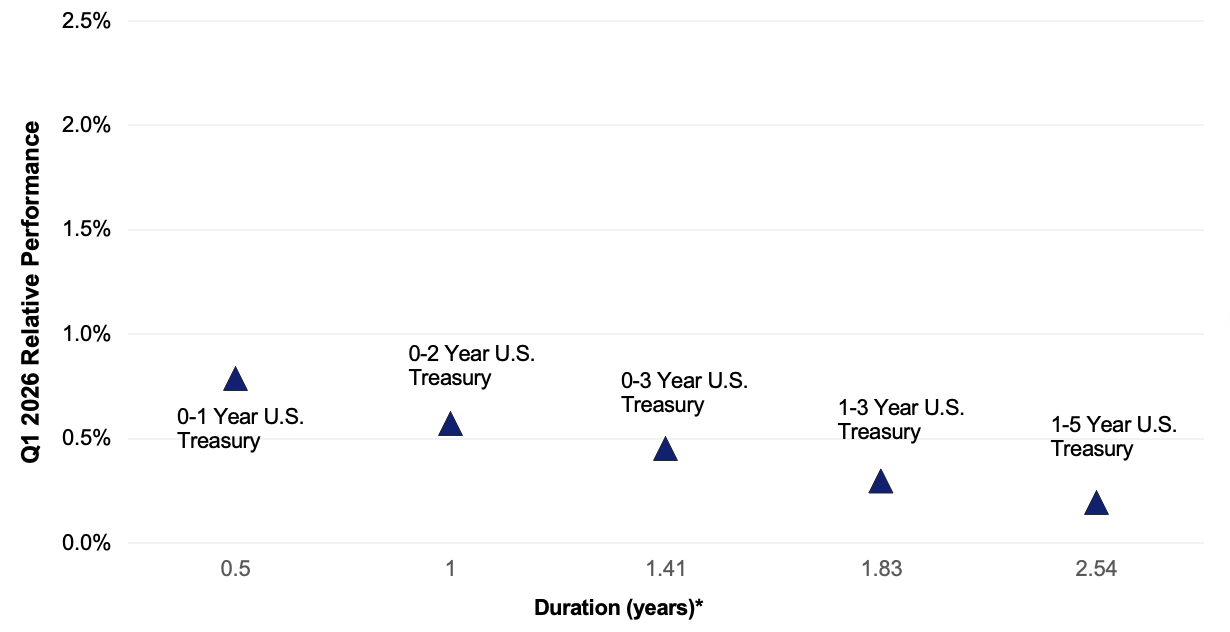
*Duration estimate is as of 3/31/2026
U.S. Treasury yields moved higher across the curve with the most pronounced increases occurring in the front and intermediate maturities. Against this backdrop, duration positioning was a meaningful driver of relative performance. Returns were tightly aligned with duration levels, with each incremental increase in effective duration corresponding with progressively lower returns. The roughly 60 bps performance gap between the 0-1 Year U.S. Treasury and the 1-5 Year U.S. Treasury is significantly wider than we have been accustomed to in recent quarters. Periods like this underscore that front-end yields can be the most sensitive to macro developments, and further, that Fed policy expectations remain fluid.
Credit Spread Changes
|
ICE BofA Index |
OAS* (bps) 12/31/2025 |
OAS* (bps) 3/31/2026 |
Change (bps) |
|---|---|---|---|
|
1-3 Year U.S. Agency Index |
1 |
-9 |
-10 |
|
1-3 Year AAA U.S. Corporate and Yankees |
7 |
2 |
-5 |
|
1-3 Year AA U.S. Corporate and Yankees |
25 |
29 |
4 |
|
1-3 Year A U.S. Corporate and Yankees |
44 |
54 |
10 |
|
1-3 Year BBB U.S. Corporate and Yankees |
71 |
84 |
13 |
|
0-3 Year AAA U.S. Fixed-Rate ABS |
50 |
47 |
-3 |
Credit spread movements in Q1 were somewhat mixed. Sectors such as Agencies, AAA Corporates, and AAA ABS tightened modestly reinforcing investors' preference for high quality credit. By contrast, lower-rated corporate segments experienced mild spread widening. Importantly, the magnitude of this move does not currently signal any broad deterioration in credit conditions. Investment grade corporate credit spreads remain near multi-year lows, and we continue to be constructive from a fundamental standpoint. Elevated all-in yields, particularly in the front end of the curve, helped to absorb higher new issue volumes.
Credit Sector Relative Performance of ICE BofA Indexes
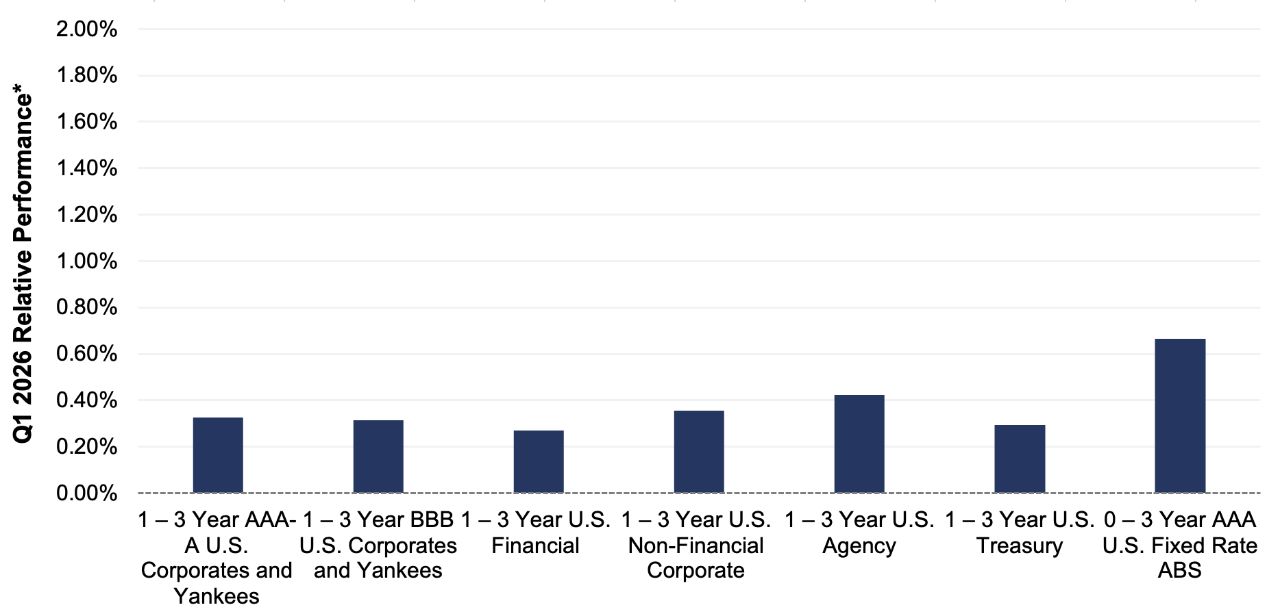
ICE BofA Index
AAA-A Corporate index outperformed the Treasury index by 3.3 bps.
AAA-A Corporate index outperformed the BBB Corporate index by 1.1 bps
U.S. Financials underperformed U.S. Non-Financials by 8.6 bps
Allocations to credit influenced returns at the margin, but were not nearly as dominant of a factor this quarter as duration. Broad credit portfolios slightly outperformed Treasuries; while at the industry level, financials lagged a bit. AAA fixed-rate ABS posted the highest returns; underscoring the sector’s defensive profile, attractive income, and limited duration exposure.
What strategic moves were made and why?
Taxable Portfolios – The Federal Reserve elected to maintain the policy rate in a 3.50%-3.75% range at both its January and March meetings. During the quarter, escalating tensions in Iran introduced greater two-sided risk to the economic outlook, prompting markets to quickly reprice expectations for the path of monetary policy. The 2-year Treasury yield proved to be the most sensitive point on the curve, briefly exceeding 4% for the first time since mid-2025 and finishing the quarter 35 BPS above year-end levels. Against this backdrop, duration positioning was the dominant driver of relative returns in the first quarter. In response to higher interest rates, we increased portfolio duration targets relative to benchmarks, deploying cash and selectively reallocating from floating-rate notes to extend duration. Credit exposure contributed only modestly to performance during the period. While lower- to mid-rated investment grade corporates experienced some spread widening, the magnitude of the move does not indicate broad credit stress or any meaningful deterioration in underlying credit fundamentals. Corporate bond issuance was exceptionally strong to start the year. According to SIFMA data, approximately $755 billion of new investment-grade bonds came to market through March, making it one of the largest first-quarter supply periods on record outside of pandemic-driven years. Notably, this elevated issuance persisted despite heightened interest rate volatility and geopolitical uncertainty, reflecting a combination of issuer opportunism, deep investor demand, and stable credit conditions.
Tax Exempt and Tax-Efficient Portfolios – Municipal markets experienced notable rate volatility to begin the year. Short and intermediate term municipal yields declined meaningfully through late February. Demand for municipals was fueled by higher levels of bond maturities and coupon payments. The subsequent rise in yields during March largely mirrored broader fixed-income weakness, as markets confronted rising energy prices and reassessed expectations for Federal Reserve policy. Importantly, technical conditions remained firmly positive throughout the quarter. Flows into long-term municipal bond mutual funds and ETFs were positive for nearly the entire period, averaging just over $2.1 billion per week. This steady inflow of capital compressed short-term yields, limiting entry opportunities for much of the quarter. Portfolio durations were allowed to temporarily move shorter relative to benchmarks. This tactical positioning proved timely, as we were later able to capitalize on the back up in rates to realign durations with benchmarks.
How are you planning on positioning portfolios going forward?
Taxable Portfolios – While markets may continue to focus on the inflationary implications of higher energy prices in the near term, we believe the eventual path for interest rates is lower. Historically, the Federal Reserve has been reluctant to respond to energy price shocks with rate hikes, given the largely supply-driven nature of these price increases. Tightening policy under such conditions is generally viewed as ineffective and carries a meaningful risk of over-tightening, particularly when monetary policy operates with long and variable lags against what may ultimately prove to be a temporary spike in prices. Consistent with this framework, recent Federal Reserve communications suggest a preference to maintain policy rates at current levels for an extended period, which we view as the next several meetings at a minimum. While we continue to see a path toward at least one additional rate cut in 2026, the timing now appears more likely to shift toward the latter part of the year. In this environment, our duration positioning is expected to remain slightly long relative to benchmarks. We would reassess this posture if interest rate levels more fully reflect potential downside risks to growth stemming from the conflict, or alternatively, if measures of inflation expectations were to become meaningfully more concerning. From a credit perspective, we view the recent widening in spreads as a tactical opportunity. Credit fundamentals remain sound, and we believe current valuations offer an attractive entry point to selectively increase corporate exposure. Accordingly, we will look to add to credit allocations where portfolio capacity allows.
Tax Exempt and Tax-Efficient Portfolios – While municipal technicals will likely remain challenging in the near term and broader fixed-income yields may remain volatile, we expect both conditions will become supportive over time. Typically, increased reinvestment demand from municipal bond maturities and coupon payments occurs during the summer months. Markets also appear hopeful for some easing of geopolitical tensions over that same timeframe. Accordingly, we will view further increases in rates as attractive opportunities to further extend portfolio durations, with neutral to modestly long targets versus benchmarks. Credit fundamentals across the municipal market remain broadly resilient, supported by elevated reserve levels and generally stable revenue trends at the state and local level. At the same time, fundamental dispersion is beginning to increase, reinforcing the importance of issuer and sector selectivity as post-pandemic fiscal tailwinds fade.
Sources
Bloomberg
https://www.federalreserve.gov/monetarypolicy/files/monetary20260128a1.pdf
https://www.federalreserve.gov/monetarypolicy/files/monetary20260318a1.pdf
https://www.federalreserve.gov/monetarypolicy/files/fomcprojtabl20260318.pdf
https://www.newyorkfed.org//markets/opolicy/operating_policy_251210a
https://appropriations.house.gov/news/press-releases/signature-moment-fy26-appropriations-signed-law-president-trump
https://www.aau.edu/newsroom/leading-research-universities-report/congress-wraps-fy26-science-and-education-funding
https://www.bbc.com/news/articles/cn8146l0n55o