Quarterly Portfolio Manager Commentary
June 30, 2022

Cash Management Portfolios
What market conditions had a direct impact on the bond market this quarter?
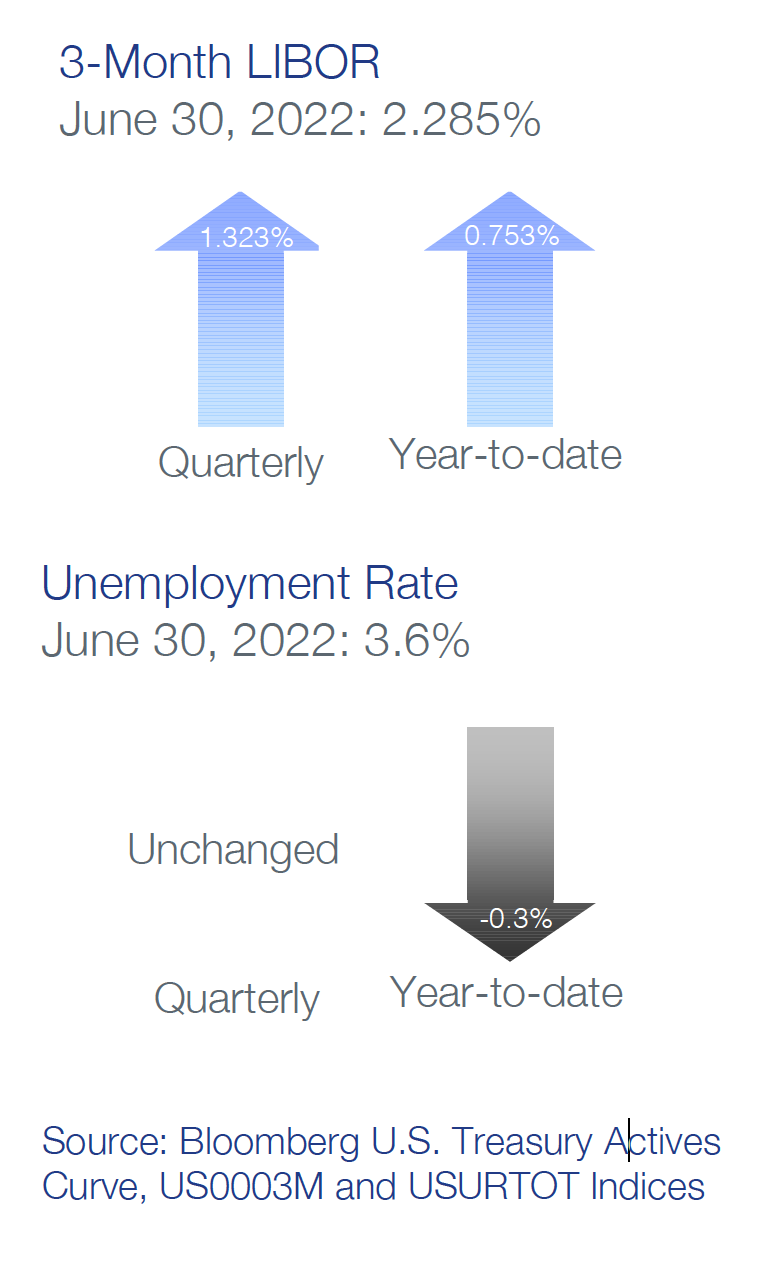
Economic Activity – U.S. economic conditions continued to weaken throughout the second quarter as broad-based inflation pressures intensified and sentiment deteriorated with the growing acceptance that aggressive Federal Reserve (Fed) tightening is likely to push the economy into a recession. U.S. Gross Domestic Product (GDP) recovered during the second quarter (Q2) following the first quarter’s 1.6% contraction, but growth estimates are subdued in the 1.0% to 2.0% range. The headline Consumer Price Index (CPI) rose to 9.1% in June, with CPI ex. food and energy year-over-year (YoY) growth easing to 5.6%. The Fed’s preferred inflation index – the PCE Core Deflator Index – increased 6.3% YoY for May, off the peak of 6.6% in March, but still near the highest levels since 1983. Inflation is projected to be near peak levels with commodity prices showing signs of easing. But given the persistence of supply chain issues and wage and price pressures, we expect inflation to remain elevated into 2023. U.S. consumers are feeling the effects of high inflation and tightening monetary policy with retail sales growth declining throughout the quarter and consumer confidence near its lowest levels on record. Employment conditions also remain tight. May U.S. job openings stand at 11.25 million open positions versus June’s total unemployed workers in the labor force of 5.91 million. Further emphasizing strong labor demand, the U3 unemployment rate was stable in June at 3.6% and Average Hourly Earnings rose a healthy 5.1% YoY. Monthly Nonfarm Payrolls (NFP) growth averaged 375,000 during Q2, below last year’s pace, but strong versus pre-pandemic levels. Despite broad-based labor market strength, historically tight conditions are constraining economic growth and pressuring prices higher.
Monetary Policy – The Fed broke from its more normal 25 basis points (bps) rate hike pace with oversized rate hikes of 50 bps at the May 3 meeting and 75 bps at the June 15 meeting. At quarter-end, federal funds futures suggest another 75 bps at the July 27 meeting was likely and a year target range of 3.25% to 3.50%. Surging inflation data convinced the Fed to become more aggressive with the pace and magnitude of its rate hikes and Chairman Powell suggested policymakers will be more data dependent as opposed to following previous rate guidance going forward. The Fed kicked off its balance sheet reduction program (QT) with a $47.5 billion cap on QT in June through August and a $85 billion cap thereafter.
Fiscal Policy – After two years of unprecedented fiscal stimulus to counter the negative economic impact of COVID-19, government spending will likely be a drag on U.S. GDP in 2022. For the most part, state and local governments are in excellent shape as reserves are flush following strong tax collections and federal pandemic relief funding. Despite recent efforts in the U.S. Senate to negotiate a scaled-back economic package, we believe the probability of further fiscal stimulus measures is low given current inflation pressures and the difficulty in passing legislation during the 2022 election cycle.
Credit Markets – Continued tightening of financial conditions has taken a toll on fixed income markets with higher yield curve levels and wider credit spreads in the quarter. A combination of tighter monetary policies, high inflation, and recession fears has increased volatility, not only in risk assets, but in U.S. Treasury yields. Secondary market liquidity is reduced versus previous periods, with wide bid-ask spreads impacting all sectors, including treasuries. As expected, the pace of new issue corporate and asset-backed opportunities has declined with higher rates and more limited investor demand. Market technicals continue to suppress very front-end T-bill yields and continue to trade well below overnight repo levels and the federal funds target rate.
Yield Curve Shift
|
U.S. Treasury Curve |
Yield Curve 3/31/2022 |
Yield Curve 6/30/2022 |
Change (bps) |
|---|---|---|---|
|
3 Month |
0.482% |
1.626% |
114.4 |
|
1 Year |
1.595% |
2.742% |
114.7 |
|
2 Year |
2.335% |
2.953% |
61.8 |
|
3 Year |
2.512% |
3.008% |
49.6 |
|
5 Year |
2.460% |
3.038% |
57.8 |
|
10 Year |
2.338% |
3.013% |
67.5 |
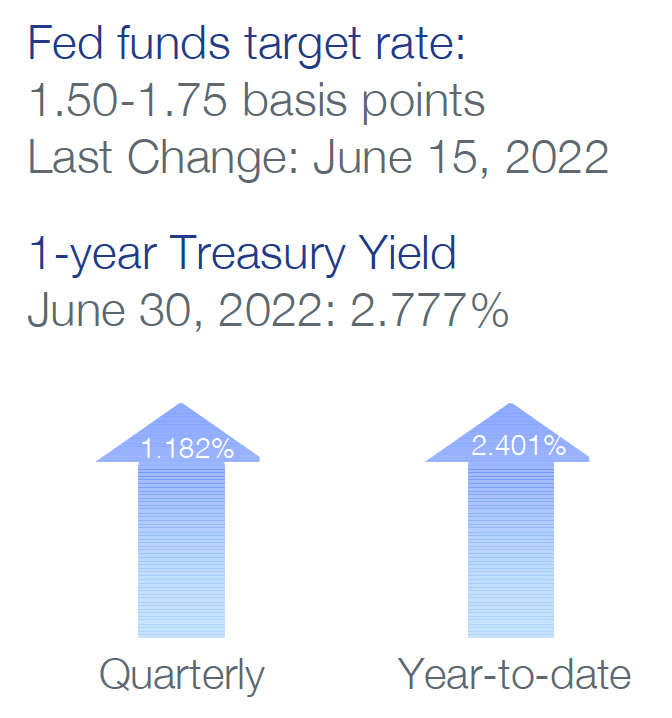
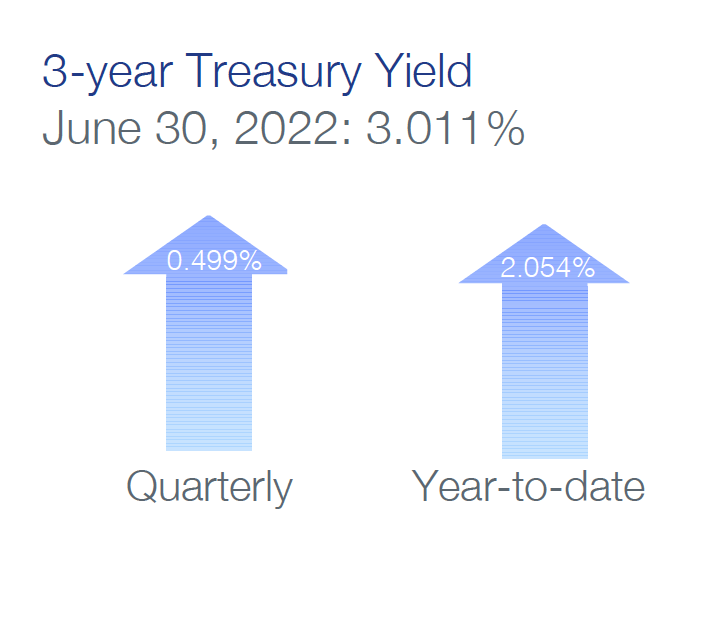
Treasury yield curve levels continued to surge in the quarter, propelled by 125 bps of Fed tightening and elevated inflation data. The three-month to 10-year portion flattened 46.9 bps to 138.7 bps. At the same time, the two-year to 10-year portion of the yield curve flattened 5.7 bps, creating an essentially flat to sometimes inverted yield curve. .
Duration Relative Performance

*Duration estimate is as of 6/30/2022
Q2 2022 U.S. Treasury performance played out as expected, with longer duration strategies underperforming their shorter-duration counterparts.
Credit Spread Changes
|
ICE BofA Index |
OAS* (bps) 12/31/2021 |
OAS* (bps) 6/30/2022 |
Change (bps) |
|---|---|---|---|
|
1-3 Year U.S. Agency Index |
2 |
5 |
3 |
|
1-3 Year AAA U.S. Corporate and Yankees |
12 |
10 |
-2 |
|
1-3 Year AA U.S. Corporate and Yankees |
28 |
40 |
12 |
|
1-3 Year A U.S. Corporate and Yankees |
56 |
82 |
26 |
|
1-3 Year BBB U.S. Corporate and Yankees |
93 |
138 |
41 |
|
0-3 Year AAA U.S. Fixed-Rate ABS |
71 |
94 |
23 |
Option-Adjusted Spread (OAS) measures the spread of a fixed-income instrument against the risk-free rate of return. U.S. Treasury securities generally represent the risk-free rate.
Outside of the AAA category, corporate credit spreads widened in the quarter as recession fears and lower corporate profitability weighed on the sector.
Credit Sector Relative Performance of ICE BofA Indexes

*AAA-A Corporate index underperformed the Treasury index by 20.8 bps in the quarter.
AAA-A Corporate index outperformed the BBB Corporate index by 36.0 bps in the quarter.
U.S. Financials underperformed U.S. Non-Financials by 21.2 bps in the quarter.
Higher yields and wider credit spreads pushed all fixed income sectors into negative returns for the second quarter. While still negative, performance was noticeably better than in Q1, as the rise in yields beyond one-year were more muted and index coupon levels were higher than at the start of the year. Down in credit continues to underperform versus higher rated counterparts, given their greater vulnerability to recession fears and diminished market liquidity.
What strategic moves were made and why?
Taxable Portfolios – While still negative, fixed income investment returns were decidedly better than in the first quarter, illustrated by ICE BofA 1-5 Year U.S. Treasury Index’s second quarter performance of 0.812% versus -3.162% in the first quarter. Not surprisingly, given the rise in U.S. Treasury yields, shorter duration strategies outperformed long duration. Unfortunately, unrealized loss positions in existing portfolio holdings worsened in Q2, primarily due to the jump in yields, and to a lesser extent, wider credit spreads. The good news is portfolio current yields are marked to more appropriate levels given current market conditions, which will provide a better cushion against further negative price actions should rates continue to rise. In addition, portfolio book yields improved and will continue to climb at an accelerated pace as portfolio cash flows are reinvested at significantly higher levels. Wider corporate credit spreads were a logical outcome from increased recession concerns, deteriorating corporate profitability and tightening financial conditions. For our investment-grade universe, fundamental credit quality remains solid, and we do not believe any portfolio holding represents a threat to principal.
Tax Exempt and Tax-Efficient Portfolios – Municipal bond funds continued to experience heavy outflows due to general market conditions and rising interest rates. With approximately $75 billion in bond fund redemptions YTD, opportunities for secondary market trading were abundant. We actively bought short munis, most notably during the first part of the quarter. A rapidly changing Fed path was a major consideration, but we pressed forward with these purchases for several reasons. Positioning was one of the key factors as we looked to balance accounts that had entered the period with short duration and big allocations to VRDNs. A mix of both variable and fixed rate securities is a prudent strategy. The seasonality of the municipal market was another consideration. Our objective was to add duration in advance of the summer months, which tend to see demand versus supply imbalances. Relative ratios were attractive, with municipal yields in some cases approaching 90% to 100% of comparable treasury yields. Additionally, the steepness of the curve presented a terrific opportunity to increase current income as one-year to three-year yields priced in aggressive Fed interest rate moves.
How are you planning on positioning portfolios going forward?
Taxable Portfolios – While there has been significant cheapening of both the U.S. Treasury yield curve and credit spreads, our near-term risk outlook suggests both are vulnerable to further deterioration. For rates, the Fed is determined to reach some form of neutral rate policy, which we view as around 3.50%. In this scenario, the math dictates higher yields for the front-end of the curve, with one- to three-year treasuries particularly vulnerable. The Fed is almost certainly going to raise rates at least 75 bps at the July 27 meeting and follow-up with another oversized hike in September, accomplishing a significant portion of the Fed’s policy rate objectives. Given this outlook, we expect to maintain a short-to-benchmark duration strategy in the third quarter. As for credit, strong consumer and investment-grade corporate balance sheets support the fundamental credit quality of issuers in our universe, which is especially important as recession risk rises and fiscal and monetary support wane. That said, we believe there are few catalysts to spark spread tightening from current levels, with macro and market risks (recession, corporate earnings, quantitative tightening, system leverage) skewing toward further spread widening. We favor shortening portfolio spread duration with greater allocations to corporates in the one-year and less area and being more selective with issuers purchased out the curve. AAA-rated asset-backed securities and financials remain some of our favored sectors. Rate volatility has improved the value of callable agencies as a high-quality option to corporate and government bullets.
Tax Exempt and Tax-Efficient Portfolios – We expect less activity over the next couple months. The seasonality discussed above has already negatively impacted municipal yields. Relative ratios versus treasuries have declined to the 50% to 60% range. These are unattractive levels to put new money to work, and we don’t expect that will change much until the September or October timeframe. We would also look for that same period to bring some greater clarity on the trajectory of both inflation and the economy. In the meantime, we will be patient and likely keep any reinvestment as short as possible. For tax-efficient accounts, corporates or even treasuries will probably be a better alternative.
Sources
Bloomberg C1A0, CY11, CY21, CY31, G1P0, ICE Bond, JOLTTOTL, NFP TCH, PCE CYOY, US0003M, USUETOT and USURTOT Indices
Bloomberg, U.S. Economic Forecast
Bloomberg, U.S. Treasury Actives Curve


