Quarterly Portfolio Manager Commentary
March 31, 2025

Cash Management Portfolios
What market conditions had a direct impact on the bond market this quarter?
Economic Activity – The fourth quarter (Q4) closed out a strong year for the U.S. economy with economic activity continuing to exceed expectations and growing at an above-trend pace throughout the year. U.S. gross domestic product (GDP) is projected to grow near 2.5% for Q4 amid still-firm domestic demand and consumer spending. Personal consumption remained healthy throughout the quarter as growing real wages and household wealth helped offset persistent headwinds from elevated prices and high interest rates. Labor market data was volatile during the quarter due to hurricane and strike-related impacts, but overall condiations suggest a resilient market that continues to normalize with stable hiring activity and low numbers of layoffs. November U.S. job openings rose modestly to 8.1 million open positions, while total unemployed workers in the labor force as of December were unchanged at 6.9 million. Monthly non-farm payrolls (NFP) growth remains healthy, averaging 170,000 during Q4 and the U3 unemployment rate was 4.1% in December, matching the level from September. Average hourly earnings growth is off its highs but remains solid at 3.9% year-over-year (YoY). The Consumer Price Index (CPI) increased to 2.7% in November versus 2.4% in September reflecting an uptick in energy prices. Core inflation’s downward momentum stalled during the quarter with CPI ex- food and energy rising 3.3% YoY in November, consistent with the pace in September. The Federal Reserve’s (Fed) preferred inflation index – the PCE Core Deflator Index – increased 2.8% YoY in November. The path back to the Fed’s 2% inflation target remains elusive as minimal progress has been made to curtail elevated core services prices. While recent easing pressures within shelter costs offer an encouraging sign, the Fed is becoming increasingly wary of inflation risk leading to the potential for a longer pause in rate cuts to start the new year.
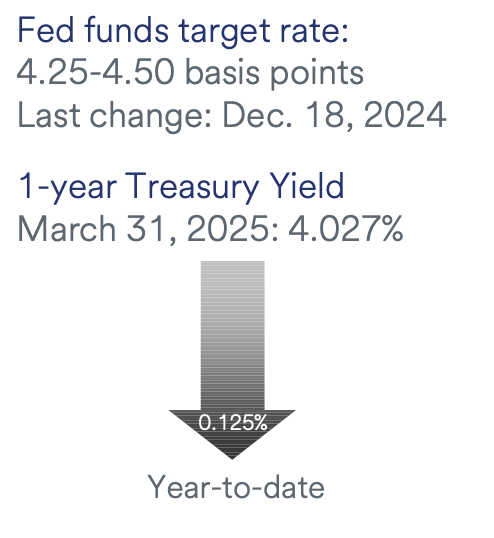
Monetary Policy – The Fed lowered its federal funds target range twice during the quarter, by 25 basis points (bps) at both the November 7 and December 18 meetings, ending the year at 4.25% to 4.50%. The Fed’s post-meeting statement was little changed in December, only adding “the extent and timing” of additional rate moves will be based on the incoming data, the evolving outlook, and the balance of risks. The Fed also continues to implement its balance sheet reduction program (quantitative tightening), with a monthly cap of $25 billion in Treasury securities and $35 billion of agency mortgage-backed securities. The December rate cut was viewed as a “hawkish cut” by market participants with the Fed appearing to lay the groundwork for a slower pace of policy easing, including an anticipated pause at the upcoming meeting in January.
The Federal Open Market Committee (FOMC) released its updated Summary of Economic Projections at the December meeting which indicates additional rate cuts are coming, but later than previously forecast. The median projection for the federal funds rate at the end of 2025 was revised higher to a range of 3.75% to 4.0%, signaling 50 bps of rate cuts during the year versus 100 bps previously. The median dots show further rate cuts of 50 bps in 2026 and 25 bps in 2027, and the estimated longer-run neutral rate was increased to 3.0% (previously 2.875%). The FOMC’s economic projections were revised to show higher expected core inflation in 2025 (2.5% vs. 2.2%) and 2026 (2.2% vs. 2.0%) compared to the prior release while revisions to GDP growth and unemployment forecasts were minimal. While the economic projections and dot plot are helpful in determining committee member’s current expectations, we do not put too much stock in them as evolving economic conditions can quickly render them out-of-date. Additionally, the timing and economic impact from the incoming Trump Administration’s policies on taxes, regulations, tariffs, and immigration will have an influence on the path of monetary policy in 2025.
Fiscal Policy – In an all too familiar scene, the federal government once again narrowly avoided a shutdown near the end of December, with Congress passing a continuing resolution to fund government operations at existing spending levels through March 14. The spending bill also included $100 billion in disaster and $30 billion in agricultural aid but did not include an extension of the debt ceiling, a late request by incoming President Trump. The debt ceiling, which was reinstated January 1, 2025, is not expected to become a binding issue until later in the year as the Treasury can use extraordinary measures and incoming tax receipts to continue funding the government over the near-term. The next year is anticipated to be an active period for fiscal policy. In addition to passing an annual budget and addressing the debt ceiling, legislation surrounding tax cuts and areas of spending reduction are expected to be high on the agenda for the new Congress and incoming Administration. On the municipal side, strong stock market performance in 2024 along with solid sales and property tax collections will aid state and local government budgets. As federal COVID money runs out, municipal entities that aligned the one-time revenues with one-time expenses will fare better than those that spent it on reoccurring expenditures.
Credit Markets – The three-month to 10-year portion of the U.S. Treasury yield curve steepened a hefty 109.1 bps in the quarter, as short rates fell on two 25 bps Fed rate cuts and long-rates moved higher on markets reducing the number of expected Fed rate cuts and growing skepticism over future progress on inflation. The yield curve shift resulted in the first positively shaped curve since Q4 2022. The severe yield curve steepening resulted in short duration strategies outperforming longer duration strategies. Lower-rated credit spreads outperformed their higher-rated counterparts.
Yield Curve Shift
|
U.S. Treasury Curve |
Yield Curve 12/31/2024 |
Yield Curve 3/31/2025 |
Change (bps) |
|---|---|---|---|
|
3 Month |
4.314% |
4.294% |
-2.1 |
|
1 Year |
4.143% |
4.020% |
-12.3
|
|
2 Year |
4.242% |
3.883% |
-35.8 |
|
3 Year |
4.273% |
3.874% |
-39.4 |
|
5 Year |
4.382% |
3.950% |
-43.2 |
|
10 Year |
4.569% |
4.205% |
-36.4 |
Duration Relative Performance
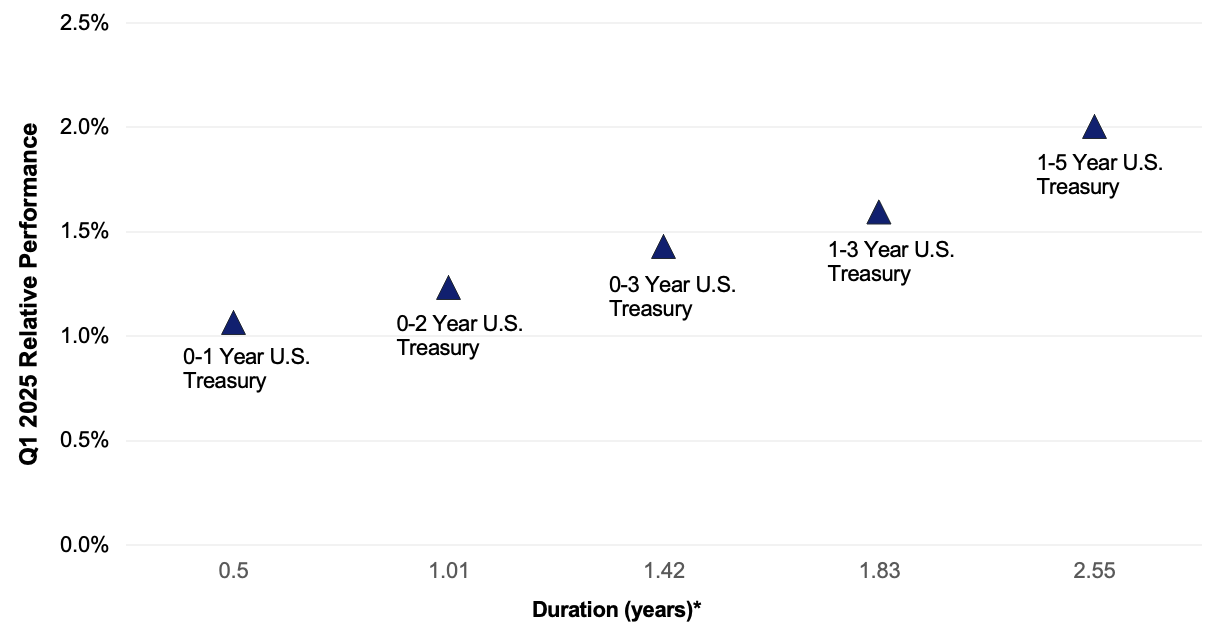
*Duration estimate is as of 3/31/2025
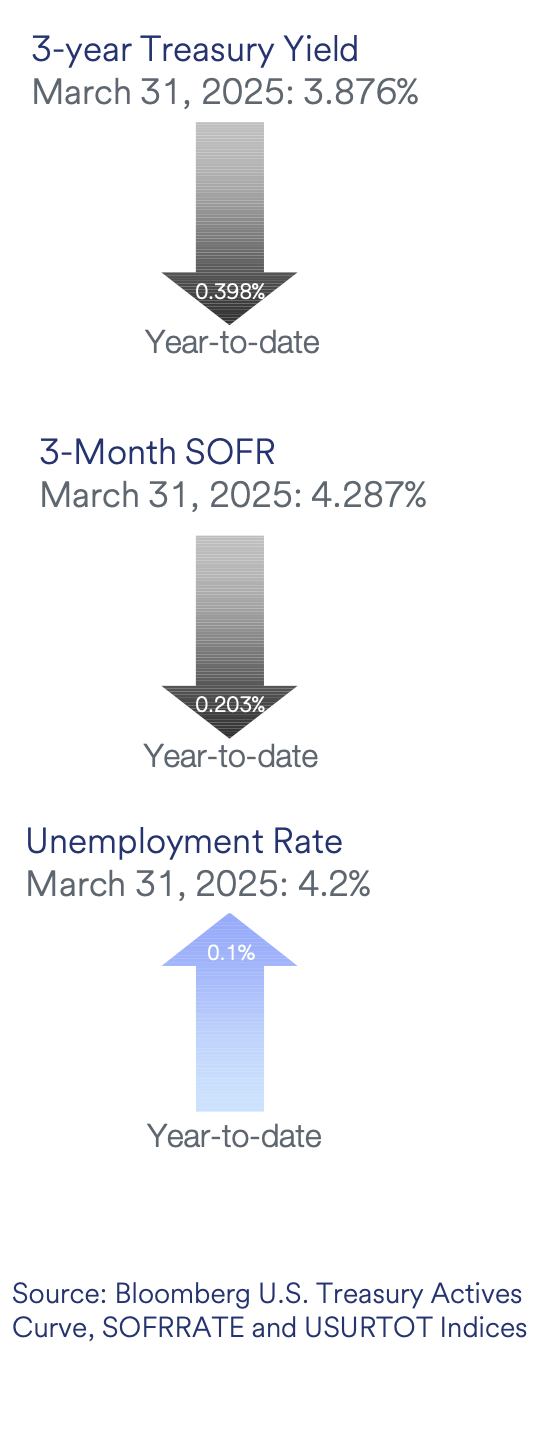
The three-month to ten-year portion of the yield curve re-inverted, as 10-year yields fell 36.4 bps with three-month yields falling only 2.1 bps on no changes to Fed rate policy in the quarter. As expected in a falling rate environment, longer duration strategies outperformed their shorter duration counterparts.
Credit Spread Changes
|
ICE BofA Index |
OAS* (bps) 12/31/2024 |
OAS* (bps) 3/31/2025 |
Change (bps) |
|---|---|---|---|
|
1-3 Year U.S. Agency Index |
4 |
3 |
-1 |
|
1-3 Year AAA U.S. Corporate and Yankees |
14 |
9 |
-5 |
|
1-3 Year AA U.S. Corporate and Yankees |
30 |
28 |
-2 |
|
1-3 Year A U.S. Corporate and Yankees |
49 |
51 |
2 |
|
1-3 Year BBB U.S. Corporate and Yankees |
75 |
80 |
5 |
|
0-3 Year AAA U.S. Fixed-Rate ABS |
38 |
50 |
12 |
Option-Adjusted Spread (OAS) measures the spread of a fixed-income instrument against the risk-free rate of return. U.S. Treasury securities generally represent the risk-free rate.
Corporate credit spreads were relatively stable in the quarter. BBB corporates underperformed their AAA-A rated counterparts as the incremental yield from BBBs could not overcome the extra widening of BBB credit spreads versus higher rated credit. Underperformance in the ABS sector was an outlier versus other spread sectors, as ABS credit spreads widened 12 bps on growing concerns over U.S. consumer health.
Credit Sector Relative Performance of ICE BofA Indexes
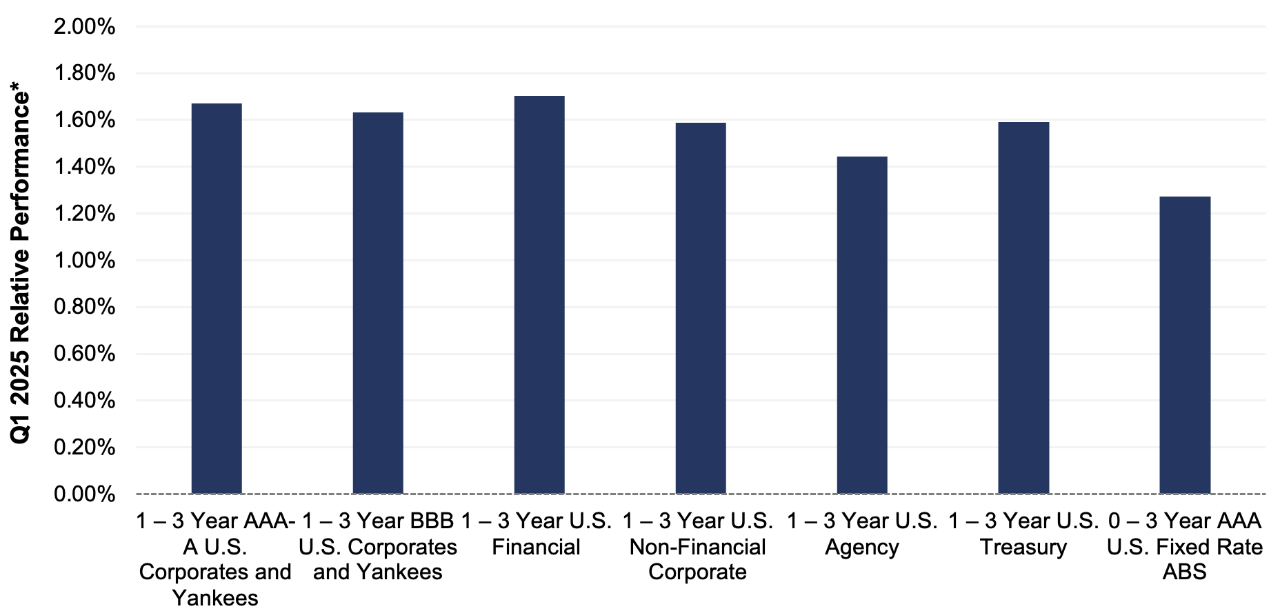
ICE BofA Index
*AAA-A Corporate index outperformed the Treasury index by 7.9 bps.
*AAA-A Corporate index outperformed the BBB Corporate index by 3.8 bps
*U.S. Financials outperformed U.S. Non-Financials by 11.7 bps
The sharp decline in yield curve levels generated strong absolute performance for all fixed income sectors. Given relatively uniform yield declines for two-year and longer maturities, along with mild credit spread changes in the quarter, performance dispersion among most sectors was muted. AAA-rated ABS was the outlier, as widening ABS spreads drove underperformance in the sector.
What strategic moves were made and why?
Taxable Portfolios – Driven by declines in yield curve levels, first quarter fixed income returns were strong. Investment-Grade (IG) corporate bonds posted solid relative returns as increased issuance levels were met with robust investor demand. Much of the spread widening seen during the second half of the quarter was offset by higher incremental income. From an excess return perspective, higher-quality and shorter-duration issuers outperformed in general during the quarter. Financials and banking issuers continued to lead most other industries across the yield curve during the quarter. Asset-Backed Securities (ABS) spreads widened from the impact of heavy new issuance levels and a modest deterioration of consumer credit fundamentals, particularly in the sub-prime sector. ABS spreads widened more than corporate spreads, resulting in underperformance over the quarter but better relative value going forward. There were no significant credit or rating events in the quarter, and no single issuer or position had a meaningfully positive or negative impact on portfolio performance.
Tax Exempt and Tax-Efficient Portfolios – We have previously noted the record-breaking pace of borrowing from municipalities in 2024. This momentum has carried forward into the new year, with more than $111 billion in tax-exempt issuance – the heaviest Q1 total since 2007. We attribute these sales volumes to several factors, including ongoing tax policy discussions, which may impact the municipal tax-exemption; rising project costs due to inflation; and unsustainable deficits at the federal level, which may push more costs downhill to state and local governments. The short end of the municipal curve steepened during the quarter, with one-year maturities falling 25 basis points and five-year investments declining a basis point. We were active buyers of primarily municipal bonds maturing in 2028 and 2029. Valuations were attractive versus recent municipal to Treasury yield comparisons. However, our chief motivation with these purchases was to keep portfolio durations from drifting too short relative to benchmarks. We believe this approach to duration management is prudent, given the vast uncertainties across markets and the economy.
How are you planning on positioning portfolios going forward?
Taxable Portfolios – Since the Trump administration’s tariff roll-out on April 2, market volatility has jumped, investor confidence has been shaken and business and consumer sentiment has fallen. Markets are forecasting between three and four rate cuts in 2025, while the Fed’s Dot Plot was left unchanged at two 25 bps rate cuts. We expect to see ongoing steepening of the yield curve given the expectation for future rate cuts. With the economic and Fed outlook increasingly uncertain, we are targeting portfolio duration neutral relative to benchmark duration. Investment-grade corporate bond fundamentals remain favorable while technicals have weakened on the margins. A protracted trade war and resulting hit to growth could weaken credit fundamentals. Valuations have repriced from narrow levels to reflect this uncertainty. We will selectively evaluate opportunities with a focus on industry and credit quality, with an eye toward tactically positioning portfolios to better take advantage of future opportunities. ABS fundamentals remain intact and underlying credit metrics remain solid. Consumer credit trends will depend on the labor market and the consumer’s response to monetary policy easing, which tends to work on a lag. We expect spreads to remain choppy heading into Q2 despite the stability in underlying technicals and view this as an opportunity to add allocations at more attractive levels. Government agency spreads are expected to remain at tight levels and will be underweighted in favor of U.S. treasuries for government-heavy accounts.
Tax Exempt and Tax-Efficient Portfolios – We expect to continue to position portfolios with durations near neutral - while acknowleding that, at times, municipal market supply and demand imbalances may lead us to a slightly more or less aggressive posture. Recent developments surrounding tax policy appear to be more positive toward preserving the municipal exemption – at least on a broad-based level. Education efforts of bond dealers and municipal bond advocates have been successful, and encouraged legislators to send multiple “Dear Colleague” letters of support to the Chair of the House Ways and Means committee. Further, some have argued that Congress may not have authority to eliminate the tax-exemption. These constitutional concerns, and the potential for court delays, may make other options for revenue offsets more attractive. And finally, and perhaps most helpful, is the Republican’s use of the “Current Policy” scoring baseline. This method has significantly reduced the amount of offsets required in the reconciliation bill to $1.5 trillion from near $5 trillion. Even absent any changes to the exemption, we remain mindful that municipal supply will still be a periodic headwind for the market in 2025. In the near term, April may be a challenging time as reinvestment demand is typically light. These municipal technical factors, along with our general economic outlook, will both continue to be important considerations in our overall strategies.
Sources
Bloomberg
https://www.federalreserve.gov/monetarypolicy/files/monetary20250129a1.pdf
https://www.federalreserve.gov/monetarypolicy/files/monetary20250319a1.pdf
https://www.federalreserve.gov/monetarypolicy/files/fomcprojtabl20250319.pdf
https://taxfoundation.org/research/all/federal/trump-tariffs-trade-war/
https://news.bgov.com/bloomberg-government-news/bgov-bill-analysis-h-con-res-14-bicameral-budget-plan