Quarterly Portfolio Manager Commentary
September 30, 2022

Cash Management Portfolios
What market conditions had a direct impact on the bond market this quarter?
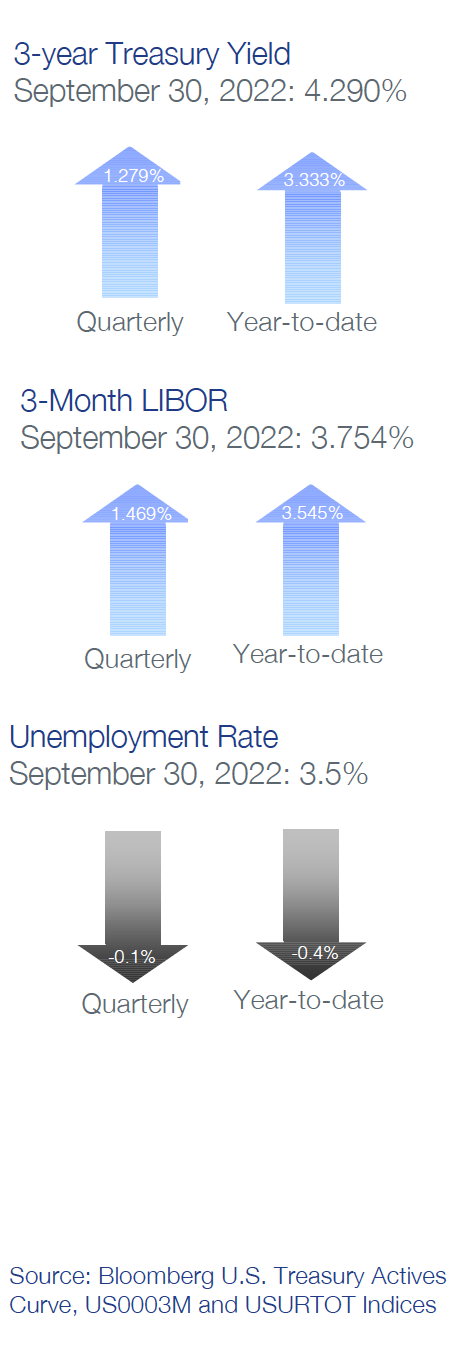
Economic Activity – U.S. economic conditions remained weak throughout the third quarter (Q3) as broad-based inflation pressures and aggressive Federal Reserve (Fed) tightening led to sluggish growth and rising interest rates weighed on consumer demand. U.S. Gross Domestic Product (GDP) grew at a 2.6% pace during Q3 following the first half contraction. The headline Consumer Price Index (CPI) declined to 8.2% in September, but CPI ex. food and energy year-over-year (YoY) rose to 6.6%. The Fed’s preferred inflation index – the PCE Core Deflator Index – increased 4.9% YoY for August, off the February peak of 5.4%, but still near the highest levels since 1983. Headline inflation declined throughout the quarter as commodity prices eased, but core inflation pressures have risen owing to accelerating shelter and labor costs. Inflation is expected to remain elevated into next year as the Fed attempts to slow demand through tighter monetary policy. U.S. consumers have felt the effects of high inflation and tightening financial conditions as real disposable income and personal savings declined during the quarter. Higher prices and a shift in consumption toward non-discretionary items supported modest growth in retail sales. Despite slowing economic momentum, employment conditions remain tight, with August U.S. job openings standing at 10.1 million open positions versus total unemployed workers in the labor force of 5.8 million. Further emphasizing strong labor demand, the U3 Unemployment Rate was 3.5% in September and Average Hourly Earnings rose a healthy 5.0% YoY. The pace of growth in Monthly Non-farm Payrolls (NFP) has begun to slow, with NFP averaging 372,000 during Q3, below last year’s pace but very strong versus pre-pandemic levels. Further easing of labor market conditions is needed as a tight job market is constraining economic growth and further pressuring prices.
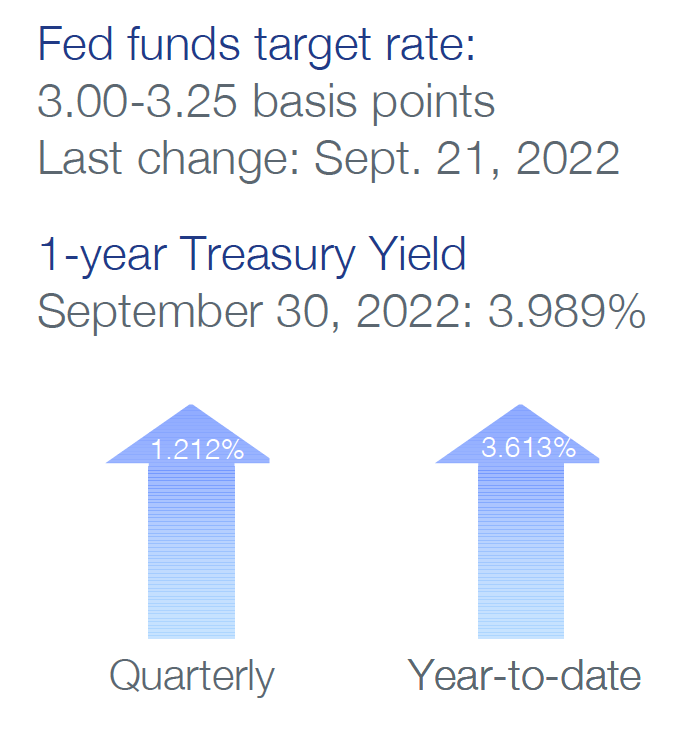
Monetary Policy – The Fed maintained its aggressive monetary policy stance with back-to-back rate hikes of 75 basis points (bps) at the July 27 and September 21 meetings. The target range for the federal funds rate is now 3.0% to 3.25% and federal funds futures suggest another 75 bps rate hike is likely at the November 2 meeting. Futures currently expect a year-end federal funds rate near 4.25%, in line with the most recent Federal Open Market Committee (FOMC) median projection, which shows a range of 4.25% to 4.50%. In September, the Fed also fully ramped up its balance sheet reduction program (quantitative tightening (QT)), raising the monthly cap to $60 billion of Treasury securities and $35 billion of agency mortgage-backed securities. The Fed has signaled additional rate hikes will be warranted and anticipates maintaining restrictive rate policies through next year to bring inflation down towards their 2% target and ease labor market conditions. As rates move further into restrictive territory, we expect the pace of tightening to moderate and become more data-dependent.
Fiscal Policy – After two years of unprecedented fiscal stimulus to counter the negative economic impact of COVID-19, government spending will likely be a drag on U.S. GDP in 2022. That said, Congress passed the Inflation Reduction Act in August. Despite its name, the Act will have no impact on inflation over the near term, instead focusing spending on investments to combat climate change, lower the cost of prescription drugs, and provide an extension of Affordable Car Act subsidies. On the municipal side, state and local governments have seen early signs of tax collections starting to slow, but strong reserves have left them in a solid position if economic conditions weaken further.
Credit Markets – Based on our analysis of credit market trends, we found that large-scale Fed rate hikes continued to drive negative absolute returns in fixed income markets in the quarter. Interest rate volatility remains high, not only quarter-over-quarter, but intraday as well. Secondary market liquidity is reduced versus previous periods, with wide bid/ask spreads impacting all sectors, including Treasuries. Higher rates and wider credit spreads have negatively impacted new-issue corporate and asset-backed opportunities. Market technical factors continue to suppress front-end T-bill yields, which continue to trade well below overnight repo levels and the federal funds target rate.
Yield Curve Shift
|
U.S. Treasury Curve |
Yield Curve 6/30/2022 |
Yield Curve 9/30/2022 |
Change (bps) |
|---|---|---|---|
|
3 Month |
1.626% |
3.247% |
162.1 |
|
1 Year |
2.742% |
3.933% |
119.1 |
|
2 Year |
2.953% |
4.279% |
132.6 |
|
3 Year |
3.008% |
4.288% |
128.0 |
|
5 Year |
3.038% |
4.090% |
105.2 |
|
10 Year |
3.013% |
3.829% |
81.6 |
Treasury yield curve levels continued to rise on the heels of an additional 150 bps of Fed tightening and stubbornly high inflation data. The three-month to 10-year portion flattened a healthy 80.5 bps to 58.2 bps. At the same time, the two-year to 10-year portion of the yield curve inverted by 45 bps.
Duration Relative Performance

*Duration estimate is as of 9/30/2022
Q3 2022 U.S. Treasury performance played out as expected, with longer-duration strategies underperforming their shorter-duration counterparts.
Credit Spread Changes
|
ICE BofA Index |
OAS* (bps) 6/30/2022 |
OAS* (bps) 9/30/2022 |
Change (bps) |
|---|---|---|---|
|
1-3 Year U.S. Agency Index |
5 |
7 |
2 |
|
1-3 Year AAA U.S. Corporate and Yankees |
10 |
9 |
-2 |
|
1-3 Year AA U.S. Corporate and Yankees |
40 |
38 |
-2 |
|
1-3 Year A U.S. Corporate and Yankees |
82 |
82 |
0 |
|
1-3 Year BBB U.S. Corporate and Yankees |
138 |
131 |
-7 |
|
0-3 Year AAA U.S. Fixed-Rate ABS |
94 |
76 |
-18 |
Option-Adjusted Spread (OAS) measures the spread of a fixed-income instrument against the risk-free rate of return. U.S. Treasury securities generally represent the risk-free rate.
Corporate credit spreads were mostly unchanged to slightly better in the quarter, with asset-backed securities spreads tightening the most in the quarter.
Credit Sector Relative Performance of ICE BofA Indexes

ICE BofA Index
*AAA-A Corporate index outperformed the Treasury index by 6.4 bps in the quarter.
AAA-A Corporate index underperformed the BBB Corporate index by 41.3 bps in the quarter.
U.S. Financials underperformed U.S. Non-Financials by 10.3 bps in the quarter.
Higher U.S. Treasury yield curve levels were the driver of negative absolute returns for fixed income indexes. Stable credit spreads helped corporate debt to outperform comparable duration treasuries due to the higher coupon income levels of spread product. This is particularly evident in the 47.7 bps outperformance of BBB corporate debt versus treasuries.
What strategic moves were made and why?
Taxable Portfolios – Fixed income returns remained in deeply negative territory as another 150 bps of Fed rate hikes, with the promise for more, pushed U.S. Treasury yield curve levels higher. Further, stubbornly high inflation data and continued labor market strength have increased interest rate volatility – often intraday – as uncertainty over the Fed’s terminal target federal funds rate and the possibility of a hard landing grows. Credit spreads were flat to slightly better in the quarter, benefitting portfolios with exposure to corporate and asset-backed securities debt. Unrealized loss positions of legacy portfolio positions continue to climb, but portfolio yields are marked to current higher levels, which will provide a greater performance cushion against further negative price actions should rates continue to rise. In addition, portfolio book yields improved and will continue to climb at an accelerated pace as portfolio cash flows are reinvested at significantly higher levels. For our investment-grade universe, fundamental credit quality remains solid, and we do not believe any portfolio holding represents a threat to principal.
Tax Exempt and Tax-Efficient Portfolios – Municipal bonds were not immune to the elevated interest rate volatility that impacted all fixed income sectors. In July, returns for short municipal positions were quite positive as strong reinvestment from bond maturities and coupon payments overwhelmed supply. However, both August and September experienced fluctuations as tax-exempt investor focus shifted to the general economic environment and Fed outlook. We took a cautious approach toward initiating new fixed-rate municipal positions during the quarter. Municipals typically respond to moves in the Treasury market with a lag, and we wanted to allow time for reasonable changes in valuation to occur. In addition, the sharp interest rate moves raised some renewed concerns of potential muni bond fund outflows. These mutual fund redemptions were accelerating in late September, reaching more than $5 billion in the last week of the month – the third highest week of outlows in 2022, according to the ICI Investment Company Institute. Sustained bid-wanted activity is likely to push short-term yields higher and improve relative valuations.
How are you planning on positioning portfolios going forward?
Taxable Portfolios – While the historic rise in interest rates has generated negative year-to-date returns for most fixed income strategies, the risk/return relationship of U.S. Treasury yield curve levels has become more balanced, with a significant portion of expected Fed rate hikes priced into current yields. In the near-term, yields inside of five years are at risk to drift higher given expectations for an additional 125 bps of Fed rate hikes in 2022, and we remain biased to be short duration versus portfolio benchmarks. However, the relative attractiveness of the yield curve favors moving portfolios closer to benchmark duration through the end of the year while remaining short, particularly for strategies with duration targets over one year. On credit, we anticipate some deterioration in certain credit metrics around the edges, but solid consumer and investment-grade corporate balance sheets support overall fundamental credit quality as the economy enters a slow growth or recessionary environment and financial conditions tighten. We continue to invest in high-quality spread product to enhance portfolio coupon income, but see few catalysts to spark meaningful spread tightening from current levels given the macro risks of recession, lower corporate earnings, quantitative tightening and overall system leverage. We favor shortening portfolio spread duration with greater allocations to short corporate bonds and increased scrutiny with issuers purchased further out the curve. AAA-rated asset-backed securities and financials remain some of our favored sectors. Rate volatility remains elevated, providing opportunities in callable agencies as a high-quality option to corporate and government bullets.
Tax Exempt and Tax-Efficient Portfolios – We believe portfolio strategies focused on allocations to both fixed and variable rates is a good approach in this rising rate environment. As we approach a peak in the federal funds rate, we will seek to achieve higher levels of fixed-rate holdings. If the current slope of the treasury yield curve holds, we are likely to favor three-year investments. This maturity area provides the best window to lock in yield if an eventual Fed easing cycle unfolds in the medium term to 2024. With municipal versus treasury relative ratios expected to remain near the 70% to 75% range, corporate allocations continue to make the most sense for tax-efficient accounts.
Sources
Bloomberg C1A0, CY11, CY21, CY31, G1P0, ICE Bond, JOLTTOTL, NFP TCH, PCE CYOY, US0003M, USUETOT and USURTOT Indices
Bloomberg, U.S. Economic Forecast
Bloomberg, U.S. Treasury Actives Curve


