Quarterly Portfolio Manager Commentary
September 30, 2021

Cash Management Portfolios
What market conditions had a direct impact on the bond market this quarter?
U.S. Gross Domestic Product (GDP) clearly lost momentum in the third quarter (Q3). Supply shortages and transportation bottlenecks inhibited the production and distribution of goods, while at the same time driving labor, energy and input prices higher. Inflation data and the timing of Federal Reserve (Fed) rate hikes being pulled forward were the key factors in market and yield curve gyrations.
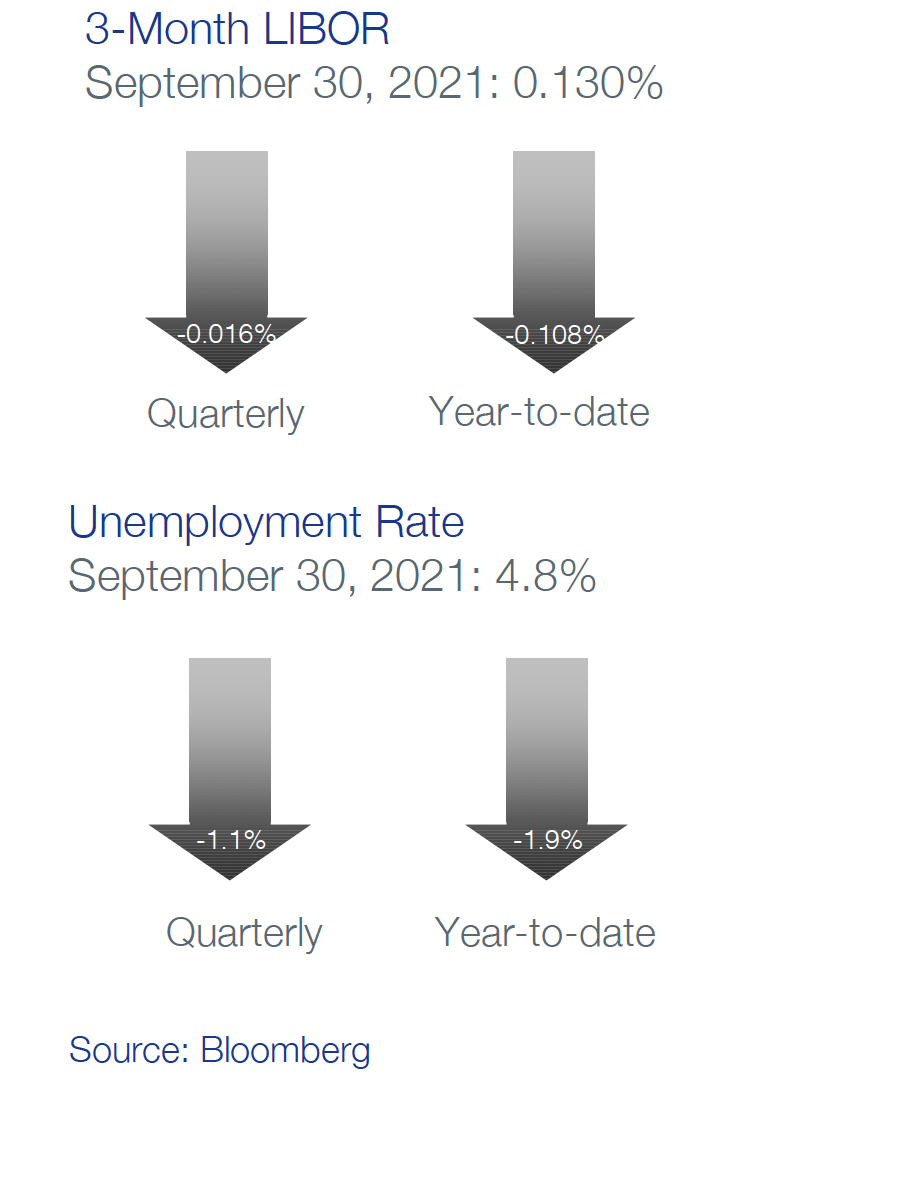
Economic Activity – U.S. GDP decelerated in Q3, with growth expectations of 3.9% after a solid 6.7% second quarter (Q2) print, although growth should remain above trend with demand outpacing supply. September’s 4.8% U3 Unemployment rate probably understates labor market tightness, as people’s willingness to return to work is increasingly uncertain. Illustrating the point, U.S. Job Openings stand at 10.439 million open positions vs. Total Unemployed Workers in the Labor Force of 7.674 million. Non-farm Payrolls (NFP) added 1.651 million jobs in the quarter, but only a disappointing 194,000 in September. NFP are down 4.97 million jobs since February 2020, despite a full recovery of GDP to pre-COVID levels. September’s ISM Manufacturing and ISM Services readings of 61.1 and 61.9 indicate significant sector expansion, but the additional output is not enough to keep pace with demand which in turn is driving inflation measures higher. The headline Consumer Price Index (CPI) hit 5.4% year-over-year (YoY) in September with CPI ex. food and energy rising 4.0% YoY. The Fed’s preferred inflation index – the PCE Core Deflator Index – grew a more modest, but still elevated, 3.6% YoY in August. Labor and supply chain issues pushing prices higher appear to be more structural in nature, challenging the Fed’s transitory thesis.
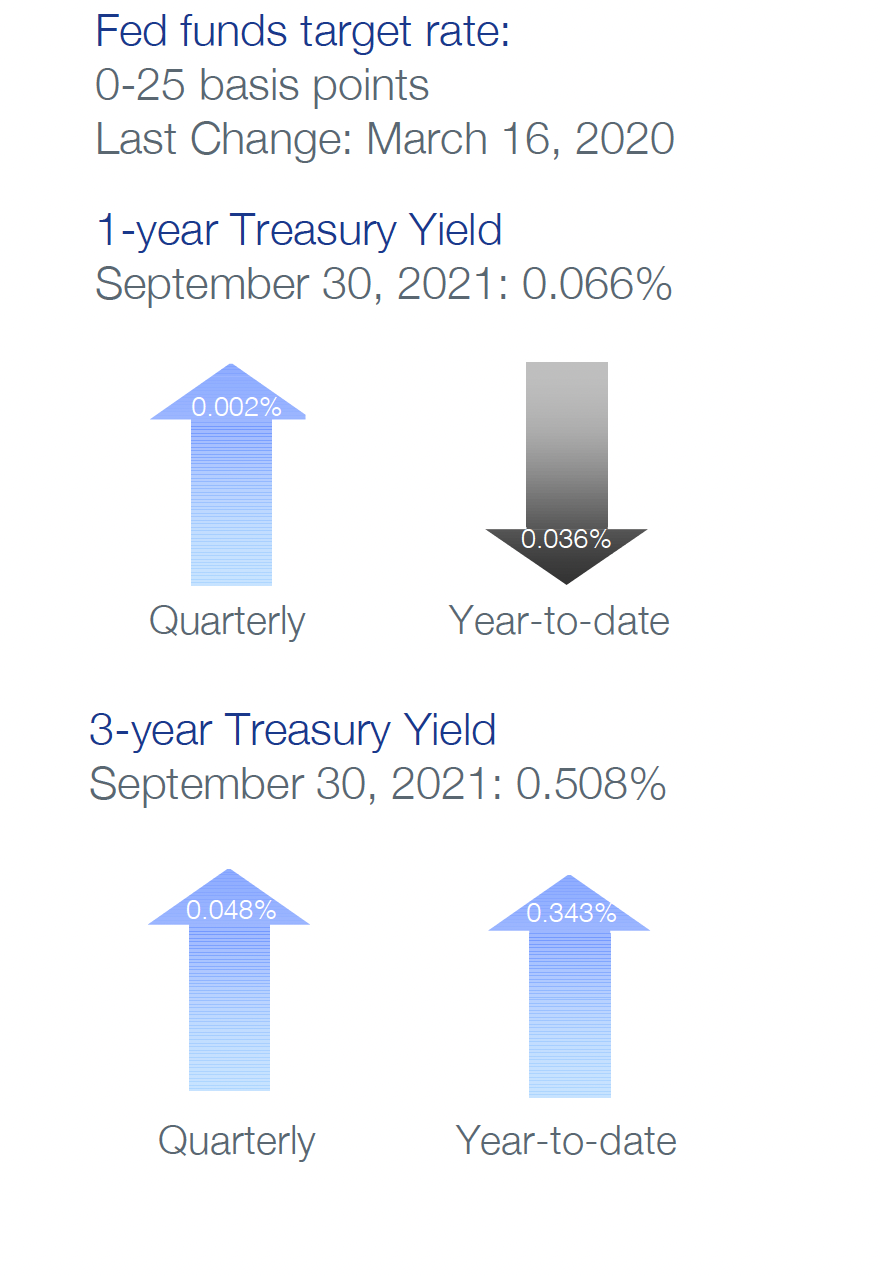
Monetary Policy – The Fed maintained its 0.00% to 0.25% federal funds target range and continued to make $120 billion in monthly asset purchases, but Fed officials are clearly considering tapering asset purchases as inflation pressures become more acute. At the September meeting, policymakers agreed liftoff for tapering in November or December at a $15 billion monthly pace was appropriate, implying an end to quantitative easing by mid-2022. For the most part, participants in the September Fed Dot Plot pulled forward the timing of future Fed rate hikes, with half the participants expecting liftoff in 2022. Federal funds futures suggest the initial rate hike will occur at either the September 21st or November 2nd meeting next year. Usage of the Federal Reserve New York’s Reverse Repo Program reached $1.604 trillion at quarter-end, a sign there is ample liquidity in the financial system with much of the Fed’s asset purchases recycling back onto the Fed’s balance sheet.
Fiscal Policy – Contentious fiscal policy debates over the size and timing of President Biden’s Build Back America plan and the stalled infrastructure bill complicated Congress’s ability to extend the federal debt ceiling. After the federal debt ceiling suspension expired in July, investors grew concerned maturing October Treasuries could face a technical default once extraordinary budget measures were exhausted. Responding to Democrat complaints that there was not enough time in the legislative calendar to increase the debt ceiling through the reconciliation process, Minority Leader McConnell offered to lift the debt limit by $480 billion, providing enough room to fund the government into early December. While markets applauded the brief reprieve from debt limit concerns, December T-bill yields have already been pressured higher.
Credit Markets – Credit markets continued the trends of the last several quarters: strong primary and secondary market liquidity, high investor demand for yield, tight credit spreads and low front-end yields. Corporate credit conditions and company fundamentals remain solid, partially justifying overall low yields and spreads in investment-grade debt. Front-end U.S. Treasury yields remain under pressure from cash entering the system through the Fed’s asset purchases and the drawdown of the Treasury General Account. October T-bill yields were pressured five to 10 basis points (bps) higher due to uncertainty over the resolution of the U.S. federal debt ceiling and the potential for a technical default on maturing Treasury debt.
Yield Curve Shift
|
U.S. Treasury Curve |
Yield Curve 06/30/2021 |
Yield Curve 09/30/2021 |
Change (bps)* |
|---|---|---|---|
|
3 Month |
0.041% |
0.033% |
-0.8 |
|
1 Year |
0.066% |
0.068% |
0.2 |
|
2 Year |
0.249% |
0.276% |
2.7 |
|
3 Year |
0.460% |
0.508% |
4.8 |
|
5 Year |
0.889% |
0.965% |
7.6 |
|
10 Year |
1.468% |
1.487% |
1.9 |
Measured from the end of Q2 to the end of Q3, there was relatively little movement in the treasury yield curve for securities maturing inside of three years, resulting in performance differentiated on the margin by incremental coupon income for longer benchmarks. Inside the quarter, however, there were significant shifts in yield curve levels, illustrated by the generic three-year treasury which varied between a low of 0.318% on August 3rd and a high of 0.555% on September 27th. Given the curve’s gyrations, longer benchmarks strongly outperformed in July, before underperforming in August and September.
The three-month to ten-year portion of the yield curve steepened a mere 2.7 bps to 145.4 bps. Three-month yields should remain near the RRP rate of 0.05%, while ten-year yields will be influenced more by inflation expectations, tapering of Fed asset purchases and progress toward solving production and transportation bottlenecks.
Duration Relative Performance

*Duration estimate is as of 09/30/2021
Given only minor yield curve moves measured from the end of Q2 to the end of Q3, performance differentials were primarily influenced by modestly greater coupon income for longer duration benchmarks. Yields over three years did move higher vs. short-end yields, resulting in essentially neutral quarterly performance for the 1-5 Year U.S. Treasury benchmark.
Credit Spread Changes
|
ICE BofA Index |
OAS* (bps) 06/30/2021 |
OAS* (bps) 09/30/2021 |
Change (bps) |
|---|---|---|---|
|
1-3 Year U.S. Agency Index |
1 |
-1 |
-2 |
|
1-3 Year AAA U.S. Corporate and Yankees |
7 |
7 |
0 |
|
1-3 Year AA U.S. Corporate and Yankees |
16 |
15 |
-1 |
|
1-3 Year A U.S. Corporate and Yankees |
29 |
29 |
0 |
|
1-3 Year BBB U.S. Corporate and Yankees |
54 |
56 |
2 |
|
0-3 Year AAA U.S. Fixed-Rate ABS |
29 |
27 |
-2 |
| *OAS = Option-Adjusted Spread |
Option-Adjusted Spread (OAS) measures the spread of a fixed-income instrument against the risk-free rate of return. U.S. Treasury securities generally represent the risk-free rate.
Corporate credit spreads were stable across the board, with only the BBB space seeing a mild two bps widening. Credit continues to benefit greatly from strong investor demand and the asset purchase programs of global central banks.
Credit Sector Relative Performance of ICE BofA Indexes

*AAA-A Corporate index outperformed the Treasury index by 7.0 bps in the quarter.
AAA-A Corporate index underperformed the BBB Corporate index by 9.0 bps in the quarter.
U.S. Financials outperformed U.S. Non-Financials by 0.6 bps in the quarter.
With only minor changes in credit spreads in the third quarter and spreads already at or near historic lows, it is not surprising that performance differentials were fairly compressed across asset classes. BBB corporate credit was the stand-out performer as coupon income overwhelmed the slight widening of credit spreads in the quarter.
What strategic moves were made and why?
Taxable Portfolios – Compared to previous quarters, there were only minor movements in both the short-term yield curve and corporate credit spreads. Given the minimal changes in the short-term Treasury yield curve measured from the end of Q2 to the end of Q3, duration played a slight role in performance differentiation. Three to five-year yields did rise five to seven bps in the quarter, providing a headwind to performance for portfolios with higher allocations to this sector. As expected in a stable spread environment, credit outperformed treasuries on higher coupon income. BBB corporates continued to be the strongest performer in the investment-grade space, benefitting from strong investor demand for yield and a generally benign outlook for corporate credit. As has been the case for most of 2021, negative public credit rating actions were infrequent in the quarter and no individual issuer in our approved universe suffered meaningfully negative price action due to a credit downgrade. Portfolio construction is challenged by ultra-low front-end yields, tight credit spreads and limited supply of investment-grade debt.
Tax Exempt and Tax-Efficient Portfolios – Steady municipal bond fund inflows and heavy reinvestment from July coupon payments and maturities led to a strong start and early municipal price gains. However, absolute levels of just five bps in one-year and 13 bps in three-years were met with investor resistance – and eventually front-end yields settled back within a basis point of where the quarter began. A shift in views toward more aggressive timing and pace for Fed policy was a contributing factor as well, as yields shifted a bit higher. The muni yield curve from 1-5 years remains noticeably flatter than other fixed income sectors. Municipal investors currently pick up around 37 bps of additional income vs. 90 bps in the Treasury market. Market technicals for taxable municipals with maturities inside of five-years were also strong. These securities traded at spreads as low as five to ten bps over comparable treasuries during the quarter. The outlook for municipal credit remains favorable on the back of the direct federal payments received earlier this year and the strong economic recovery.
How are you planning on positioning portfolios going forward?
Taxable Portfolios – With corporate spreads near historically tight levels, portfolio construction will focus on stronger issuers we believe are less vulnerable to an economic slowdown or a deterioration in credit and liquidity conditions. While credit spreads tilt toward the tight side, valuations are reasonable given the favorable corporate credit environment of strong economic growth, central bank liquidity support and solid company fundamentals. Primary markets remain the best way to secure bonds in size and at more attractive levels given the scarcity and richness of secondary market opportunities. The underlying loan performance of our asset-backed securities pools remains robust and we will continue to maximize exposure where allowed in portfolios. Although we expect rates to be biased upward, the noticeable October increase and steepening of the Treasury yield curve offers an opportunity to extend duration and reduce the short position of portfolios vs. their benchmark.
Tax Exempt and Tax-Efficient Portfolios – We have been on the sidelines for some time now in terms of new purchases of fixed-rate, tax-exempt municipals. Our lack of participation has been a function of both absolute and relative valuations. We may be compelled to add some one-year maturities in the coming quarter – especially to the extent markets begin to price in an earlier Fed liftoff. Supply for these shorter maturities is quite limited, however, which presents some challenges. Municipalities continue to be in a good cash position following receiving direct federal payments earlier this year as part of the American Rescue Plan. Note issuance has declined 40%+ YoY as cash management type financing is not needed. We have little interest in going further out the tax-exempt curve (2-5 year) as current relative valuations remain well below longer-term averages. Positioning for tax-efficient mandates will be consistent with the strategies outlined in the taxable section above. The majority of new reinvestment will be directed to the corporate bond sector. Taxable municipals remain a viable option for diversification and credit quality considerations. The credit curve for short taxable municipals is flat with only four bps in additional spread achieved by extending from two to five years. With this in mind, our focus for any new taxable municipal investments will likely be at the shorter end of that range.
Sources
Bloomberg


