Quarterly Portfolio Manager Commentary
June 30, 2021

Cash Management Portfolios
What market conditions had a direct impact on the bond market this quarter?
The second quarter was highlighted by strong U.S. Gross Domestic Product (GDP) growth, higher than expected inflation data and continued monetary accommodation from the Federal Reserve (Fed). Inflation data and concerns the Fed is behind on the policy curve have been key drivers of market and yield curve gyrations.
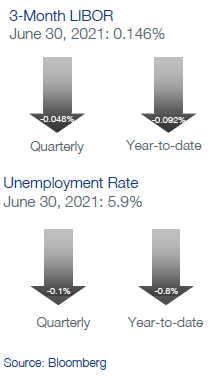
Economic Activity – Second quarter (Q2) GDP is expected to reflect a robust 9% to 10% growth rate as the economic reopening expanded and healthy consumers increased their spending. Current forecasts are for Q3 and Q4 growth to remain at a healthy 7% and 5% clip. Non-farm Payrolls added 1.702 million jobs in Q2, but still lag February 2020 total payrolls by 6.764 million jobs. The 5.9% U3 Unemployment rate seems to be understating labor market tightness, illustrated by the historically low U.S. Job Openings by Industry total of 9.209 million positions vs. Total Unemployed Workers in the Labor Force of 9.484 million. Anecdotal evidence suggests labor participation has been hindered by enhanced unemployment benefits scheduled to expire in September. June’s ISM Manufacturing and ISM Services readings of 60.6 and 60.1, respectively, are off recent highs but still indicate strong growth. For context, any reading over 50 indicates sector expansion. The expected rise in the Consumer Price Index (CPI) has exceeded expectations with year-over-year prices jumping 5.4% and CPI ex food and energy rising 4.5%. The Fed’s preferred inflation index – the PCE Core Deflator Index – grew a more modest, but still elevated, 3.4% year-over-year through May. Inflation expectations measured by the five-year TIPs vs. Treasuries ended the month at 2.5%, noticeably above the Fed’s 2% average inflation target.
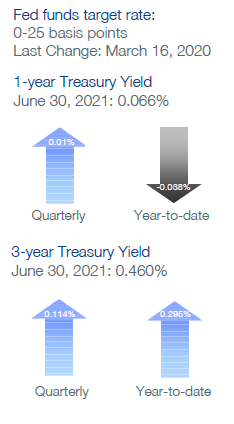
Monetary Policy – Despite rising consumer prices and growing concerns the Fed is behind the inflation curve, the Fed remained steadfast in its views inflationary pressures are transitory and related to supply dislocations created by COVID. As expected, the Fed maintained its 0.00% to 0.25% federal funds target range, but the June 16th Dot Plot did indicate the majority of Fed officials believe the first rate hike will be in 2023 rather than 2024, as signaled in the March 17th report. The Fed has clearly begun “thinking about thinking about” tapering its $120 billion monthly asset purchases with actual reductions expected by year-end. In June, the Fed lifted the administrative rates for the Fed NY Reverse Repo Program (RRP) and Interest on Excess Reserves (IOER) by five basis points (bps) to 0.05% and 0.15%, respectively. The rate increase has helped keep short market rates from going negative and allowed the money market fund (MMF) industry to absorb excess liquidity in the system through the massive increase in RRP usage by MMFs.
Fiscal Policy – After passing a $1.9 trillion COVID relief package in March, the Biden Administration and Democratic-controlled Congress are pushing for a multi-trillion dollar plan to address the country’s infrastructure as well as funding many traditional Democrat priorities. President Biden is proposing to pay for his plan with tax increases, including an increase in the corporate tax rate from 21% to 28%. Republicans have countered with more modest proposals in the $600 - $800 billion range focusing specifically on traditional infrastructure such as roads and bridges. Markets are debating the value of further stimulus into a rapidly expanding economy and its potential impact on inflation. The suspension of the U.S. debt ceiling is set to expire in July, and to date, there has been little progress addressing the issue in Washington or in the press. While the possibility of a technical default of U.S. Treasury debt is extremely low, the debt ceiling does have implications for Treasury debt issuance and continued drawdown of the Treasury’s General Account (TGA).
Credit Markets – Credit markets continued the trends of the last several quarters: strong primary and secondary market liquidity, high investor demand for yield, tight credit spreads and low front-end yields. Corporate credit conditions and company fundamentals continue to improve, partially justifying overall low yields and spreads in investment-grade debt. Front-end U.S. Treasury yields remain under pressure from cash entering the system through the Fed’s asset purchases and the drawdown of the TGA. The Fed’s five bps increase of RRP and IOER rates has kept short-term rates from turning negative and allowed the MMF industry to absorb excess deposits in the system. Five-year and longer U.S. Treasury yields were lower in Q2, reversing course from Q1, as strong demand and growing concerns over COVID variants outweighed higher inflation numbers.
Yield Curve Shift
|
U.S. Treasury Curve |
Yield Curve 03/31/2021 |
Yield Curve 06/30/2021 |
Change (bps)* |
|---|---|---|---|
|
3 Month |
0.015% |
0.041% |
2.5 |
|
1 Year |
0.056% |
0.066% |
1.0 |
|
2 Year |
0.160% |
0.249% |
8.8 |
|
3 Year |
0.346% |
0.460% |
11.5 |
|
5 Year |
0.939% |
0.889% |
-5.0 |
|
10 Year |
1.740% |
1.468% |
-27.2 |
The three-month to ten-year portion of the yield curve flattened 29.7 bps to 142.7 bps, due almost entirely to the 27.2 bps decline in ten-year yields. Three-month yields are expected to remain near the RRP rate of 0.05%, while ten-year yields influenced market confidence on the reflation trade, inflation expectations and guidance on future Fed asset purchase policies.
Duration Relative Performance

*Duration estimate is as of 06/30/2021
Benchmarks with exposure to maturities two years and less had little performance impact from yield curve moves. Benchmarks with exposure to securities maturing in the five-year and longer benefitted from declining yields.
Credit Spread Changes
|
ICE BofA Index |
OAS* (bps) 03/31/2021 |
OAS* (bps) 06/30/2021 |
Change (bps) |
|---|---|---|---|
|
1-3 Year U.S. Agency Index |
2 |
1 |
-1 |
|
1-3 Year AAA U.S. Corporate and Yankees |
11 |
7 |
-4 |
|
1-3 Year AA U.S. Corporate and Yankees |
22 |
16 |
-6 |
|
1-3 Year A U.S. Corporate and Yankees |
40 |
29 |
-11 |
|
1-3 Year BBB U.S. Corporate and Yankees |
71 |
54 |
-17 |
|
0-3 Year AAA U.S. Fixed-Rate ABS |
35 |
29 |
-6 |
| *OAS = Option-Adjusted Spread |
Option-Adjusted Spread (OAS) measures the spread of a fixed-income instrument against the risk-free rate of return. U.S. Treasury securities generally represent the risk-free rate.
Corporate credit spreads declined across the board, with lower-rated corporate credit outperforming their higher-rated peers. Credit in general benefitted from an improving economic outlook and, by extension, improved credit conditions and strong technical factors.
Credit Sector Relative Performance of ICE BofA Indexes

*AAA-A Corporate index outperformed the Treasury index by 21.8 bps in the quarter.
AAA-A Corporate index underperformed the BBB Corporate index by 30.0 bps in the quarter.
U.S. Financials outperformed U.S. Non-Financials by 7.4 bps in the quarter.
With credit spreads already at or near historic lows, credit’s strong Q2 performance was impressive and mildly unexpected. Financial credit outperformed their industrial counterparts.
What strategic moves were made and why?
Taxable Portfolios – Yield curve gyrations played a much smaller role in Q2 portfolio performance than in the previous quarter. In Q2, the oneyear to five-year portion of the U.S. Treasury curve flattened six bps after steepening 62.7 bps in Q1, implying less dispersion of portfolio returns based on yield curve allocations. The belly of the curve did underperform slightly as two- and three-year yields rose 8.8 and 11.5 bps, respectively. Corporate credit and asset-backed securities were strong performers in the quarter, providing incremental coupon income and price appreciation from tightening credit spreads. The BBB sector meaningfully outperformed AAA-A-rated credit as improved economic growth and continued monetary accommodation from global central banks favored lower quality issuers. Negative public credit rating actions were minimal in the quarter and no individual issuer in our approved universe suffered meaningfully negative price action due to a credit downgrade. Portfolio construction continues to be challenged by ultra-low front-end yields, tight credit spreads and a limited supply of investment-grade debt.
Tax Exempt and Tax-Efficient Portfolios – The front end of the muni yield curve was relatively stable during the quarter. Similar to the Treasury curve, there was some modest flattening as one-year maturities edged a few basis points higher and five-year yields declined by a couple of basis points. It is worth noting the municipal curve is noticeably flatter from 1-5 years than other fixed income sectors. In fact, extension trades in this area only generate about half as much incremental yield. Demand for the municipal asset class remains quite strong. Approximately $50 billion has flowed into municipal bond funds year-to-date, buoyed by the prospect for higher tax rates and also increased comfort with municipal credit fundamentals. The reopening of the economy has been a boon for several major municipal revenue sources, including income and sales taxes. The strength of the housing market will also be supportive in years to come through higher property tax receipts. If that were not enough, the direct payments in May courtesy of the American Rescue Plan have solidified the financial position of state and local government credits across the country. Ratings agencies have responded by turning positive on even the most troubled names, such as the State of Illinois, which saw its bond ratings raised by a notch.
How are you planning on positioning portfolios going forward?
Taxable Portfolios – With corporate spreads at historically tight levels and the yield curve more vulnerable to gyrations from stronger growth and inflation numbers, positioning portfolios to manage downside risks will continue to be a key strategic priority. For portfolio duration, we expect the Fed to remain on hold at least into 2023, with investors biased toward pulling the rate hikes forward given troublesomely high inflation data. We continue to expect yields in the one- to five-year portion of the curve to rise and steepen by year-end, but will look to opportunistically extend duration when interest rate risk becomes more balanced. Short duration strategies inside six months will remain yield-starved with repo and T-bills trading inside five bps and commercial paper inside 15 bps. While credit spreads are tilted toward being on the tight side, valuations are reasonable given the favorable corporate credit environment of strong economic growth, continued central bank liquidity support and solid company fundamentals. Corporate and agency securities with exceedingly tight credit spreads continue to be viewed as sources of cash to be redeployed into higher-yielding or higher-quality options. Primary markets remain the best way to secure bonds in size and at more attractive levels given the scarcity and richness of secondary market opportunities. The underlying loan performance of our asset-backed securities pools has been impressive and we will continue to maximize exposure where allowed in portfolios.
Tax Exempt and Tax-Efficient Portfolios – Positioning for tax-efficient mandates will echo the strategy outlined in the taxable section above. We continue to be only limited participants in the municipal market. This is a function of the current relative valuation of municipal securities vs. corporates and account objectives to maximize after-tax income. A sense of the strength of the municipal market is reflected in a three-year, tax-exempt security trading at a yield that is a mere 44% of the comparable treasury investment. The prospect for higher corporate tax rates may eventually tilt allocations at some point, but this is not a near-term expectation. A surge in supply is a necessary ingredient for more attractive valuations. While municipalities were active issuers in June, bringing nearly $50 billion to market, the short-end issuance is a completely different tale. Cash management needs are slim to none and note issuance has declined around 25% year-over-year. The State of Colorado has already announced it will not be issuing any notes for its General Fund this year vs. the $600 million issued in 2020. We expect other big note issuers will be in similar positions.
Sources
Bloomberg


