Quarterly Portfolio Manager Commentary
March 31, 2021

Cash Management Portfolios
What market conditions had a direct impact on the bond market this quarter?
The U.S. economic outlook has improved on the prospect for a sustained economic reopening and a flood of fiscal stimulus. Pent-up demand for goods and services along with strong consumer finances are expected to drive growth and inflation levels higher in the second quarter. Inflation fears have lifted longer rates and steepened the U.S. Treasury curve, a trend expected to continue through much of 2021.
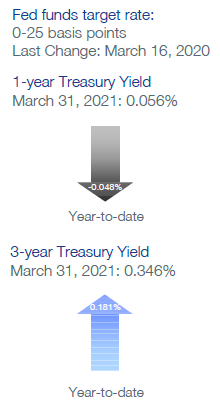
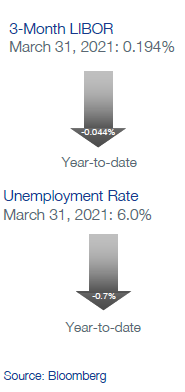
Economic Activity – The economic outlook for 2021 is exceptionally robust as economic reopening accelerates and consumer finances are bolstered by employment gains and fiscal stimulus checks. Consensus forecasts suggest 4.7% and 5.8% growth rates for the first quarter and all of 2021, respectively. Employment growth increased in the quarter with Non-farm Payrolls (NFP) adding 1.617 million jobs, including a 916k jump in March. The U3 Unemployment Rate fell to 6.0% from 6.7% at the end of 2020. Despite the strong gains, NFP data shows the economy has still shed 8.4 million jobs since last February. March’s stellar ISM Manufacturing and ISM Services readings of 64.7 and 63.7 respectively confirm the acceleration of activity. For context, any reading over 50 indicates sector expansion and the 64.7 Manufacturing print was the highest since 1980. The Federal Reserve’s (Fed) preferred inflation index – the PCE Core Deflator Index – remained subdued at 1.4% in February. However, inflation expectations as measured by the five-year TIPs vs. Treasuries continue to move higher, reaching 2.6% at the end of the quarter.
Monetary Policy – Pushing back on growing perceptions they may be falling behind the inflation curve, the Fed did not alter current policies at either the January 27th or March 17th meetings. Chairman Powell has remained steadfast in views the Fed should and will maintain highly accommodative monetary policies until substantial progress has been made achieving the twin goals of maximum employment and 2% average inflation. The March 17th Fed Dot Plot still forecasted the first rate hike for 2024, although some FOMC participants signaled an earlier rate hike may be warranted. The Fed remained committed to monthly net purchases of $80 billion in U.S. Treasury Securities and $40 billion in agency mortgage-backed securities, although there is significant debate over when the Fed should signal the need to taper purchases.
Fiscal Policy – The Biden Administration and Democratic-controlled Congress passed a $1.9 trillion COVID-19 relief package in March. The legislation sends direct payments of $1,400 to most Americans and extends a $300 enhanced unemployment benefit until September 6th, further bolstering consumer savings accounts. $350 billion in aid was also provided to state and local governments to counter the fallout from economic shutdowns. The sizable package comes on the heels of a $900 billion COVID-19 relief bill passed in the last week of December. Further, the Biden Administration is proposing a $2+ trillion plan to address the country’s infrastructure as well as funding many traditional Democratic priorities. President Biden is proposing to pay for his plan with tax increases, including an increase in the corporate tax rate from 21% to 28%. The scale of fiscal relief with the prospect for more being injected into a growing economy is virtually unprecedented and has stoked inflation fears impacting the yield curve and sparked debate over the appropriateness of current Fed policies and guidance.
Credit Markets – For much of the first quarter, front-end U.S. Treasury yields were under pressure from the flood of cash entering the system through the Fed’s asset purchases and the drawdown of the Treasury’s General Account. The Fed’s commitment to keeping policy rates near zero through 2023 limits the downside risk of front-end yields moving higher, while the yield curve’s proximity to zero offers little room for further declines. Longer yields will remain under pressure to move higher as growth and inflation measures accelerate to the upside. Yields beyond three years are more vulnerable to positive economic and vaccine news, increasing the risk of further yield curve steepening. Corporate credit conditions remain robust with strong primary and secondary market liquidity.
Yield Curve Shift
|
U.S. Treasury Curve |
Yield Curve 12/31/2020 |
Yield Curve 3/31/2021 |
Change (bps)* |
|---|---|---|---|
|
3 Month |
0.058% |
0.015% |
-4.3 |
|
1 Year |
0.104% |
0.056% |
-4.8 |
|
2 Year |
0.121% |
0.160% |
3.9 |
|
3 Year |
0.165% |
0.346% |
18.1 |
|
5 Year |
0.361% |
0.939% |
57.9 |
|
10 Year |
0.913% |
1.740% |
82.7 |
*The three-month to ten-year portion of the yield curve steepened 81.9 basis points (bps) to 172.5 bps. The severe steepening reflects the different market dynamics impacting front-end yields vs. longer-dated maturities, with three-month T-bills controlled by Fed rate policies and flows into the money market space and ten-year yields driven by growth and inflation expectations.
Duration Relative Performance

*Duration estimate is as of 3/31/2021
Benchmarks with exposure to maturities longer than three years were heavily impacted by the significant first quarter yield curve steepening.
Credit Spread Changes
|
ICE BofA Index |
OAS* (bps) 12/31/2020 |
OAS* (bps) 3/31/2021 |
Change (bps) |
|---|---|---|---|
|
1-3 Year U.S. Agency Index |
6 |
2 |
-4 |
|
1-3 Year AAA U.S. Corporate and Yankees |
11 |
11 |
0 |
|
1-3 Year AA U.S. Corporate and Yankees |
22 |
22 |
0 |
|
1-3 Year A U.S. Corporate and Yankees |
33 |
40 |
7 |
|
1-3 Year BBB U.S. Corporate and Yankees |
69 |
71 |
2 |
|
0-3 Year AAA U.S. Fixed-Rate ABS |
32 |
35 |
3 |
| *OAS = Option-Adjusted Spread |
Option-Adjusted Spread (OAS) measures the spread of a fixed-income instrument against the risk-free rate of return. U.S. Treasury securities generally represent the risk-free rate.
Corporate credit spreads were slightly wider for BBB and A-rated credits. The adjustment was related more to a mild normalization of spreads from historically low levels than a deterioration of corporate credit conditions.
The 7.706% one-year performance of the ICE BofA 1-5 Year U.S. Corporate Index (CVA0) illustrates the remarkable recovery in corporate credit spreads:
|
Date |
OAS (bps) |
Effective Yield |
Implied UST Yield |
|---|---|---|---|
|
3/23/2020* |
430 |
4.65% |
0.35% |
|
3/31/2020 |
304 |
3.32% |
0.28% |
|
3/31/2021 |
64 |
1.07% |
0.43% |
*USBAM marks 3/23/2020 as the peak of pandemic-inspired market dysfunction.
Credit Sector Relative Performance of ICE BofA Indexes

*AAA-A Corporate index outperformed the Treasury index by 0.7 bps in the quarter.
AAA-A Corporate index underperformed the BBB Corporate index by 14.1 bps in the quarter.
U.S. Financials outperformed U.S. Non-Financials by 16.2 bps in the quarter.
As expected, performance differentials among asset classes compressed vs. previous quarters as credit spreads seem to have reached a limit for additional tightening. Non-financials outperformed financials, driven primarily by the general lack of supply and high demand for investment grade industrial credit.
What strategic moves were made and why?
Taxable Portfolios - Yield curve steepening was the primary driver of performance differentiation in the quarter. Portfolios with exposure to maturities beyond three years were especially impacted by the steeper curve as the one- to five-year U.S. Treasury part of the curve steepened 62.7 bps. The dispersion of returns for portfolios with a duration of one to two years was relatively limited, with longer strategies mildly underperforming their shorter counterparts. We took advantage of the steeper curve to take some of our short duration positioning off the table and move portfolios closer to neutral vs. benchmarks. After an extended stretch of strong outperformance vs. comparable duration U.S. Treasuries, credit-sensitive assets were basically neutral for performance in the first quarter. The BBB sector outperformed AAA-A-rated credit on higher coupon income and slightly greater spread widening in the A-rated sector. A-rated industrials outperformed financials on strong demand and scarce secondary market supply. Negative public credit rating actions were minimal in the quarter and no individual issuer in our approved universe suffered meaningfully negative price action due to a credit downgrade.
Tax Exempt and Tax-Efficient Portfolios - The American Rescue Plan (ARP) bolstered the municipal bond market in multiple ways. Major municipal revenue sources, such as income and sales taxes, will benefit from the fiscal stimulus's general boost to the economy. In addition, direct payments of $350 billion to state and local governments, nearly $130 billion to K-12 education, $40 billion to higher education and billions more for public transit, airports and healthcare issuers provide an improved overall view of municipal credit. Ratings agencies took notice, moving many sectors from negative to stable outlooks. Investor demand for high-quality and liquid securities, combined with stable Fed policy in the near-term, continues to anchor front-end maturities. The municipal yield curve (1-5 years) was meaningfully steeper in the back half of the quarter. The catalysts for this move were a strengthening economic outlook and a pick-up in issuance following a rather bleak January and February. Shorter duration strategies outperformed longer duration strategies during this period.
How are you planning on positioning portfolios going forward?
Taxable Portfolios - With corporate spreads at historically tight levels and the yield curve more vulnerable to gyrations from stronger growth and inflation numbers, positioning portfolios to manage downside risks will be a priority over gaining incremental coupon income. For portfolio duration, we expect the Fed to remain on hold at least into 2023 but acknowledge current investor sentiment seems inclined to lift and steepen yield curve levels in the coming quarters. After adding duration in the first quarter to take advantage of the impressive steepening of the one- to five-year part of the yield curve, we will allow portfolio duration for our longer strategies to drift lower vs. benchmarks as the move toward higher rates plays out over time. Should interest rate risk become more balanced in the quarter, we would again look to lock in those higher yields as tactical opportunities present themselves. Short duration strategies inside six months will remain yield-starved with repo and T-bills trading inside two bps and commercial paper inside 15 bps. While credit spreads are tilted toward being on the tight side, valuations are reasonable given the favorable corporate credit environment of strong economic growth, continued central bank liquidity support and solid company fundamentals. Corporate securities with exceedingly tight credit spreads continue to be viewed as sources of cash to be redeployed into higher-yielding or higher-quality options. Primary markets remain the best way to secure bonds in size and at more attractive levels given the scarcity and richness of secondary market opportunities. The underlying loan performance of our Asset-Backed Securities pools has been impressive and we will continue to maximize exposure where allowed in portfolios.
Tax Exempt and Tax-Efficient Portfolios - We will continue to position duration short to benchmarks, as our base expectation is for yields to continue to rise throughout the remainder of the year. However, the steepening yield curve also provides opportunities to add meaningful income to portfolios. We do plan to stay somewhat active with longer maturities for this reason and hedge against any downside risks to the economy. Tax increases for corporations are clearly on the table as a means to offset some of the costs of the recent stimulus. If tax rates are indeed increased to 28%, tax-exempt municipals may become more attractive to our accounts. We believe significantly higher municipal sector allocations are a little further down the road though and corporate bond positions are likely to continue to be favored for our tax-efficient mandates in the near-term.
Sources
Bloomberg
BofA Securities, Municipals Weekly, March 19, 2021


